
Large Cap Best & Worst Report
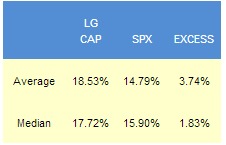
Since 2010, the top scoring stocks in our weekly large cap report have returned an average 374 bps of excess to the SPX in the following year. The best performers from our list one year ago include CLR up 80%, ITT up 61%, AMP up 50%, and LEA up 46%.
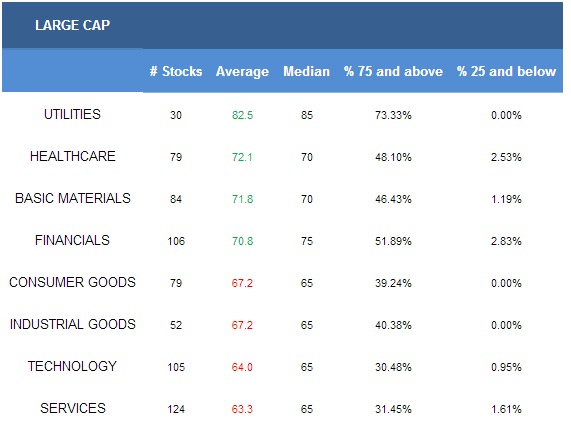
- Utilities remain the best scoring large cap sector.
- The top scoring large cap industry is healthcare plans.
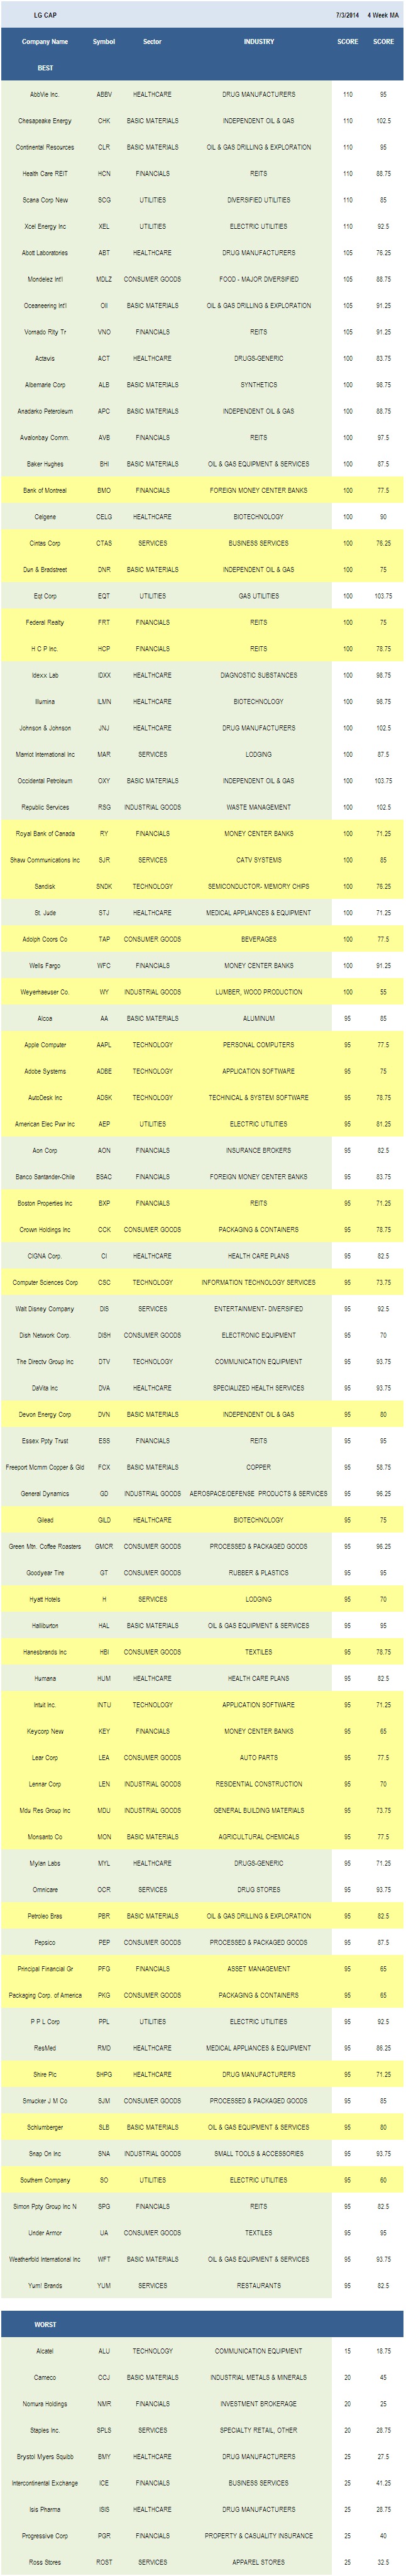
The average large cap score is 68.29, above the four week moving average score of 63.54. The average large cap stock is trading -7.97% below its 52 week high, 5.07% above its 200 dma, has 4.48 days to cover short, and is expected to post EPS growth of 13.47% next year.
Utiltiies, healthcare, basic materials, and financials score above average this week. Consumer goods, industrial goods, technology, and services score below average.
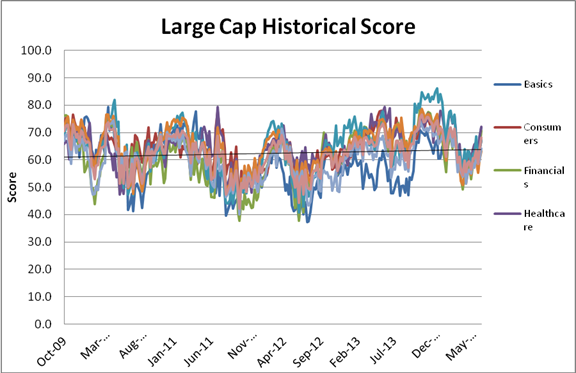
The following chart shows historical weekly large cap scores by sector.
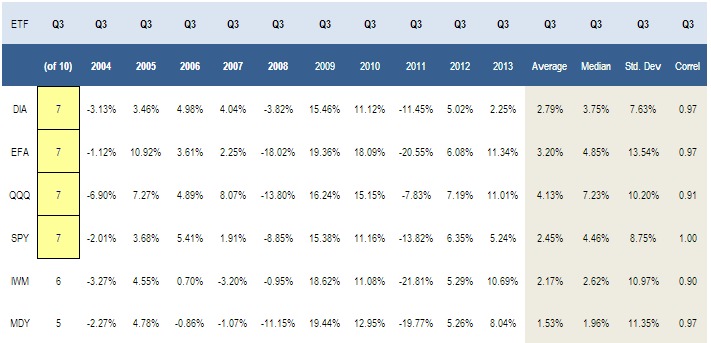
Over the past 10 years, large cap stocks have posted better returns than small cap in the third quarter. The Nasdaq 100 offers particularly intriguing seasonality, returning a median 7.23% in the quarter.
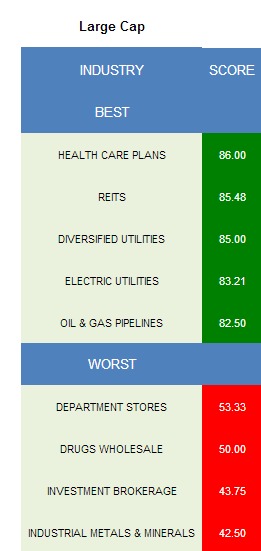
The best scoring large cap industry is healthcare plans (HUM, CI, AET, UNH). Insurers will soon report their first full quarter following ACA marketplace enrollment. Medicaid expansion is likely to remain a significant tailwind. REITs (HCN, VNO, HCP, FRT, AVB, SPG, ESS, BXP, SLG) have strong seasonal tailwinds. Financing remains cheap, vacancy rates remain low, and effective rent remains favorable. In Q2, REIS reports that office vacancy rates fell slightly (-20bps) YoY in Q2 as effective rents ticked up 0.7%. Utilities offer upside thanks to summer cooling demand and rate increases (SCG, PEG, PCG). Watch natural gas pricing for clues to spot market electricity markets (XEL, SO, PPL, AEP, DUK, AES). New pipeline capacity and shale production growth support pipelines (SE, WMB). 1,190,000 bbl/d of pipeline capacity for delivering crude oil from Canada and the midcontinent to Cushing and 1,150,000 bbl/d of capacity from Cushing to the Gulf Coast is planned.
The following table breaks out the seasonally strongest large caps for the third quarter. Each has posted gains in 9 of the past 10 years.
.jpeg)
In basics, the best industries are pipelines, drillers (CLR, OII, PBR, HP, NBR), and oil & gas equipment & services (BHI, WFT, SLB, HAL, NOV, CAM). Drilling activity typically climbs in summer following the spring thaw. According to Baker Hughes, there are 125 more active rigs in the U.S. than this time last year. Natural gas and crude rigs have climbed by 55 and 60 rigs since early April, respectively.
.jpeg)
Auto parts (LEA, TRW, MGA), major food (MDLZ), and processed & packaged goods (SJM, PEP, GMCR, MJN) score best in consumer goods. Recovering European vehicle demand supports parts suppliers. In May, commercial vehicle registrations in the EU jumped 10.8% from a year ago, brining year-to-date growth to 9.1%. Passenger car registrations were up 4.5% in May and are up 6.9% through the first five months. The top scoring financials include REITs, money center banks (RY, KEY, BNS, BK), and asset managers (PFG, BEN, AMP). Total revolving credit outstanding continues to climb.
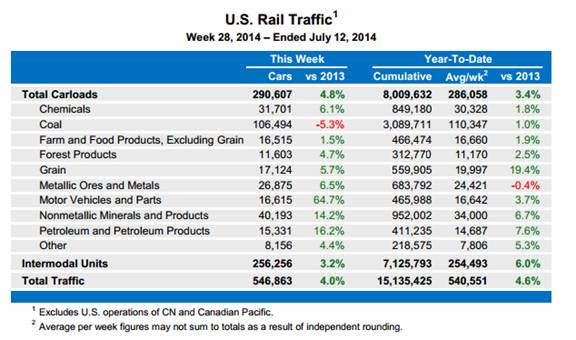
In healthcare, buy healthcare plans, medical instruments (COV, SYK, CFN), and medical appliances (STJ, RMD, MDT). Diversified machinery (XYL, IR, DOV) is the top scoring basket in industrial goods. In services, concentrate on railroads (CSX, CP, NSC), diversified entertainment (DIS, TWX), and lodging (MAR, H). Year-to-date, total rail traffic (including intermodal) is up 4.4%. Telecom services (CTL, VZ) and Internet information (GOOG, NTES, FB) score highest in technology.
.jpeg)
Disclosure: None.


