
Liquidity Trends Steady, No Surprises
The Composite Liquidity Indicator
Steady growth of central bank liquidity flow continues. There’s no sign of change or reason to expect change in the trend of stock prices from the liquidity perspective.
The composite liquidity indicator has been rising steadily as the Fed continues buying securities. Less heavily weighted components continue to either tread water or rise along with Fed cash. There’s no sign of meaningful change.
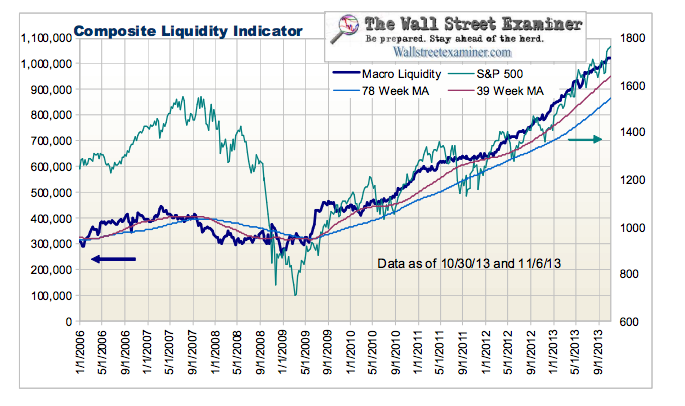
The component of the Fed’s pumping liquidity to Primary Dealers has by far the largest weighting in the Composite Liquidity Indicator (above). It seems that increasingly it’s the only indicator that matters. Ben Bernanke has turned stock market investing into a very simple game. The only indicator you need to follow is the amount of cash the Fed is pumping into the market. It’s not supposed to work that way, but for the past dozen years since the Fed began publishing its open market operations daily, we’ve seen that that is in fact the way it does work.
Effects of Other Central Banks on US Markets
According to data from Reuters, the PBoC has not grown its balance sheet at all this year. It has remained tight in that respect since July, but it has not withdrawn reserves from its system. We’ll keep an ear to news sources for any rumblings of disruption rolling out of China.
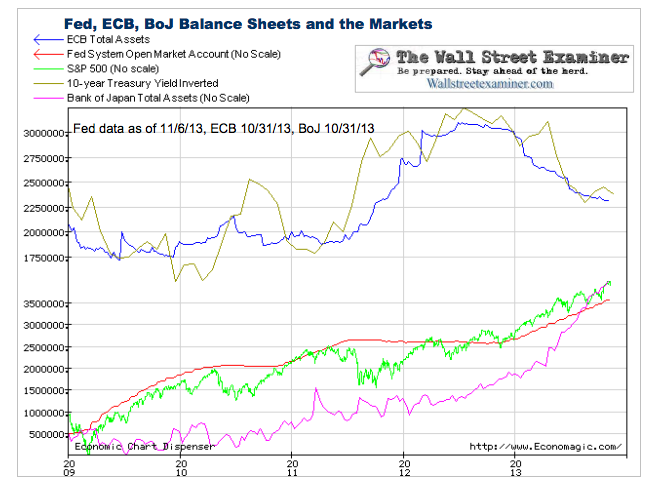
The correlation between the size of the ECB, Fed and BoJ balance sheets and the direction of financial asset prices is no accident. Treasury prices have mostly correlated with the ECB’s balance sheet, while stock prices have marched almost in lockstep with the Fed’s and BoJ’s.
The Treasury rally probably will not be sustainable if borrowers from the ECB continue to pay down debt. Recently the Treasuries have rallied counter to that trend, as other drivers assumed increased importance.
[Bond prices were generally going up as the ECB's balance sheet (blue) was going up, and down as the ECB's balance sheet was going down. The inverted 10 year Treasury Yield (gold) is a proxy for bond prices.]
Macroliquidity Component Indicators
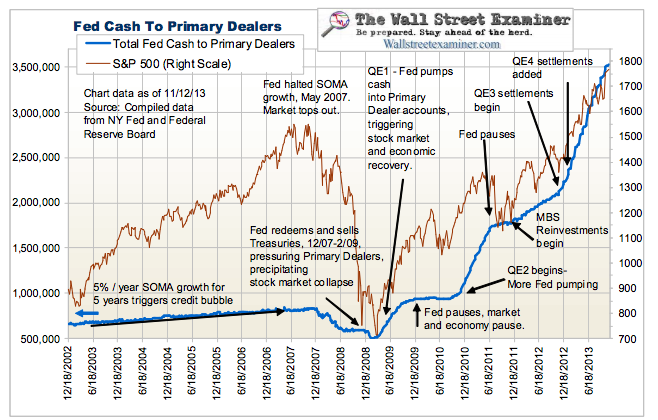
Fed Cash to Primary Dealers
The Fed Cash to Primary Dealers indicator continues to rise as the Fed settles (pays the Primary Dealers for) Treasury purchases daily and forward MBS purchases around mid month. It settled $71 billion of MBS in the period of October 10-21. It settles just its Treasury purchases, typically $11 billion per week, over the rest of the month. The November round of MBS purchases runs November 13-21. The final total will only be known when the Fed posts its monthly purchases for the prior month on November 14, but I expect the total settlements for November to be approximately $55-60 billion.
Get regular updates on the machinations of the Fed, Treasury, Primary Dealers and foreign central banks in the US market, in the Fed Report in the Professional Edition, Money Liquidity, and Real Estate Package. Click this link to try WSE's Professional Edition risk free for 30 days!
©Copyright 2013, The Wall Street Examiner Company. All rights reserved.


