
March Is Historically A Bullish Month – Weekly Market Outlook
It may have been modest, but the modest move made by the market last week pushed stocks above a very significant hurdle, which has big implications from here. In other words, don't let the small size of last week's gain fool you – it was a big deal, and may have (read 'probably did') reignited the rally that's been in place since late-2011. Underperformance from the NASDAQ Composite is a slight nag to this breakout (more on that below). And events in Ukraine and elsewhere may also affect the market rally in the short-term. Finally, there's an interesting calendar trend in place with March & April for the broad market — see the bottom of this article for details.
We can show you a crystal clear explanation below, but first, let's dissect last week's economic numbers.
Economic Data
It wasn't a terribly busy week last week in terms of economic numbers, but some of the data we got was quite important. For instance, we rounded out the look at the real estate picture with the latest batch of home price data, and new home sales. All in all, it wasn't bad, giving much-needed hope for the real estate market.
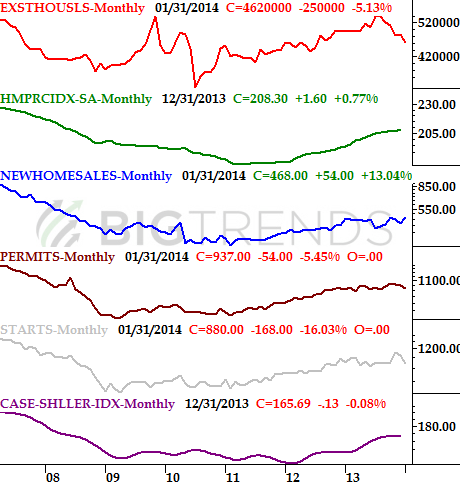
Long story made short, in December, home prices were up. The Case-Shiller index said home values were up 13.4% year-over-year, while the FHFA said house values grew 0.8% for the month.
Granted, those are December's numbers, and lousy weather could have crimped home prices in January. If they did, though, you couldn't tell it judging from the number of new homes sold in January. The Census Bureau says new homes sold at an annual pace of 468,000, well up from December's clip of 427,000 units.
The good news couldn't have come at a better time. As a reminder, the week before, existing home sales fell from a pace of 4.87 million to 4.62 million for January. Housing starts fell from a pace of 1.048 million to 888,000, while permits fell from 991,000 to 937,000. Yes, we needed a glimmer of hope on the home and construction front, and we got it.
None of this is to say the housing market is all the way back on track just because we got some encouraging pricing data and a multi-year high pace of new home sales. But, it's a step in the right direction.
Real Estate Market and Activity Chart
The only other big data we got last week was the second estimate of the fourth quarter's GDP change. It wasn't as good as first presumed, sliding from the first estimate of 3.2% to only 2.4% this time around. That's a pretty drastic shortcoming, though the market didn't seem to mind much. Most economists predict 2014's GDP growth rate will be around 2.9%.
Economic Data
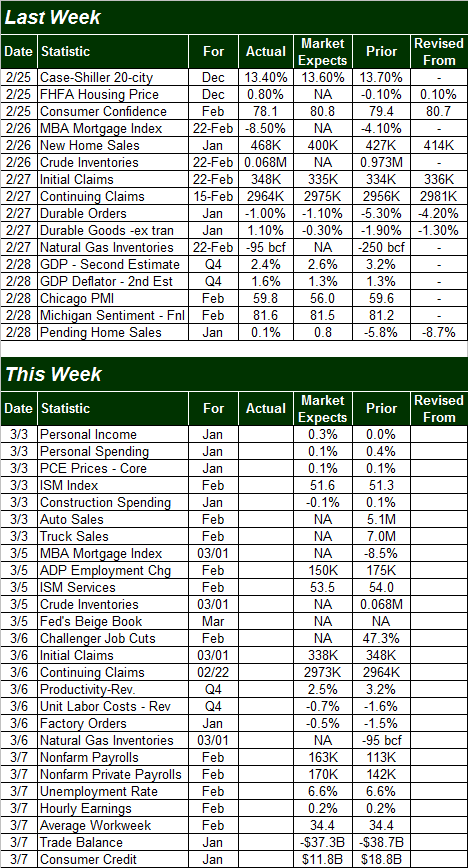
As for the coming week, it'll be a busy one, but most of the key data will focus on the employment picture.
The party gets started in earnest on Wednesday, with payroll processor ADP telling us how many new jobs they saw created last month. Experts expect a report of 150,000 new payrolls, down from the 175,000 new jobs that were created in January. The job situation is clarified a great deal more on Friday though, when the Department of Labor announces on Friday how many jobs the government says were added in February. The pros predict 163,000 new payrolls were created last month, up from February's weak reading of 113,000. The unemployment rate isn't expected to budge from its current rate of 6.6% however,
Stock Market Index Analysis
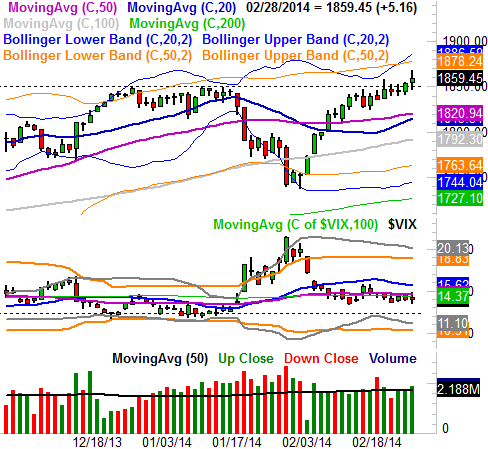
The week started out with the bears casting a shadow of serious doubt on the rally. On Thursday and Friday though, the bulls finally put the sellers on the defensive again, with the S&P 500 (SPX) (SPY) moving above a nagging ceiling at 1850. With this being the third try to do so since late December, odds are that this success will get a few days' worth – if not a few weeks' worth – of bullishness. The clincher was the fact that Friday's trading volume was higher than the recent average, suggesting the masses believe in the rally now; it has the participation it needs…. or does it?
S&P 500 & VIX – Daily Chart
While the S&P 500 did its job pretty well last week, it's suspicious that the NASDAQ (COMP) (QQQ) didn't perform as well. In fact, the NASDAQ Composite looks like it's struggling here, and remains poised for a pullback.
Take a look at the daily chart of the Composite below. While it also hit new multi-year highs on Friday, it actually closed a bit lower, and closed below the relatively important upper 50-day Bollinger band (orange). That's a red flag, in that the NASDAQ Composite typically leads the market, up as well as down. If it's struggling, the market could start to do the same sooner than later.
NASDAQ Composite & VXN – Daily Chart
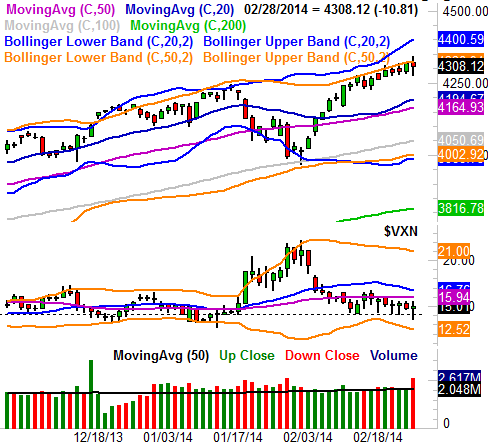
We also can't help but wonder if the NASDAQ's Volatility Index, the (VXN), has also already found its floor – at 14.10 – and is beginning to push up and off of it. If so, that will put more bearish pressure on the market. Indeed, it looks like the VXN is already trying to push up and off the support level at 14.10. If it can move back above its 20-day moving average line at 16.7, that may well be the beginning of a pullback for stocks. And, it could take less than a day for the VXN to do that. Point being, more bullishness from the market from here isn't a slam-dunk.
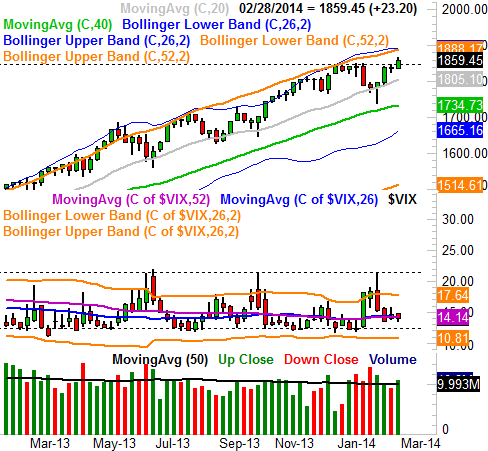
With all of that being said, though there are potential pitfalls in place, we're going to side with the bulls here. As you can see on the bigger-picture weekly chart, there's room for the S&P 500 index to keep rising until it bumps into the resistance of its longer-term Bollinger bands currently around 1888. And, by the time it could be tested, those bands could both be higher. More than that, there's still room for the S&P 500's Volatility Index, the (VIX) (VXX), to keep moving lower before it hits its floor at 12.10 and the market really gets into a struggle.
S&P 500 & VIX – Weekly Chart
Bottom line? Though the messages are mixed, we're going to give the benefit of the doubt to the bulls here and say the S&P 500 is going to follow on the 1888 area, and/or the NASDAQ is going to punch through its resistance at 4323 and make a run for 4400. Adding to that bullish argument is this little data nugget: Over the last twenty years, March has been – on average – the S&P 500's third-best performing month, topped by second-best October with a typical 1.5% gain. What's the best-performing month for the past twenty years? Incredibly enough, it's April, with an average 1.85% gain. As we should all know by now, however, we can't afford to blindly assume anything in the current market environment.
Trade Well,
Price Headley
None.


