
Market Breadth Is Trying To Tell Us Something About Risk
Volume Speaks To Conviction
Since every stock trade has a buyer and a seller, stocks do not rise when there are more buyers than sellers (something that is not possible). Instead, prices rise when the conviction to buy is greater than the conviction to sell. It can be thought of this way under bullish conditions, “I am willing to sell to you, but you are going to have to pay up”. The market recently provided us with a new conviction signal via a breadth indicator tied to volume…what could it mean for stocks?
Observable Improvement
The NYSE Advance–Decline (AD) Volume indicator is calculated by taking the total volume of advancing stocks and subtracting the total volume of declining stocks. All things being equal, stock market bulls prefer to see this indicator rise. The chart below describes the recent move that is noteworthy from a risk management perspective.
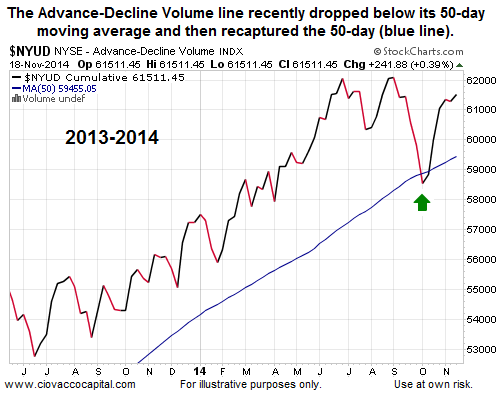
A Picture Is Worth A Thousand Words
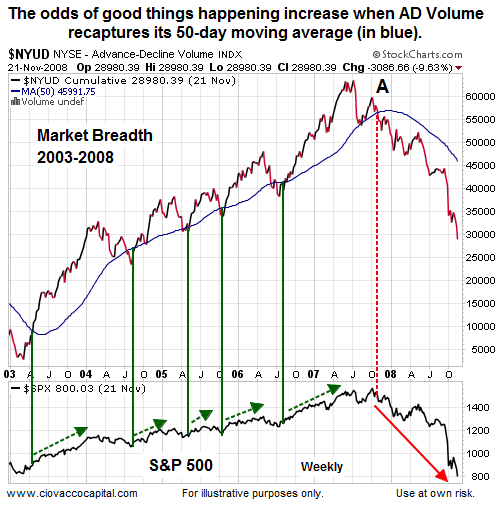
Since early 2013, the present day market is starting to look more like 2003-2007, rather than the more volatile 2010-2012 period. The AD Volume signal was helpful in both periods, but is more relevant on the chart below. The green lines show signals similar to the one that recently occurred. The bottom of the chart shows the subsequent performance in the S&P 500. The chart is a weekly chart, meaning the gains in the S&P 500 (green arrows) occurred over several weeks or several months. The signal was also helpful during the financial crisis; the indicator never said “get back in” as stocks tanked (red arrow).
Investment Implications – The Weight Of The Evidence
Since there is no such thing as a perfect indicator, we do not use this (or any) signal in isolation. Like many other market tools or data, the signal above speaks to probabilities. Probabilities acknowledge that good and bad things can happen in the markets. This signal tells us the probability of good things happening is higher today than it was in early October.
Other Areas Improving As Well
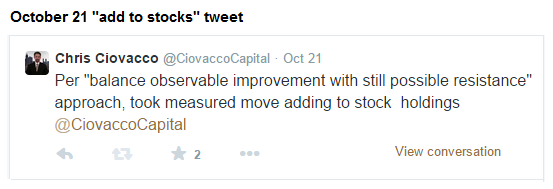
The improvement in market breadth aligns with the bigger picture probabilistic outlook described on November 17. Since the weight of the evidence has moved from unfavorable in early October to favorable, our market model has been adding to our stock holdings (SPY) over the last four weeks. If the bulls maintain control, the evidence may call for further reduction in what is now a relatively modest stake in bonds (TLT). The evidence showed enough improvement to prudently add risk to our portfolios on October 21 (see tweet below).
We also noted the odds seemed to be improving in the October article Stocks: Is It Time To Get Back In?.
Disclosure: This article contains the current opinions of the author but not necessarily those of CCM. The opinions are subject to change without notice. This article is distributed for ...
more
Comments
 No Thumbs up yet!

