
Markets Review, 21 November 2014
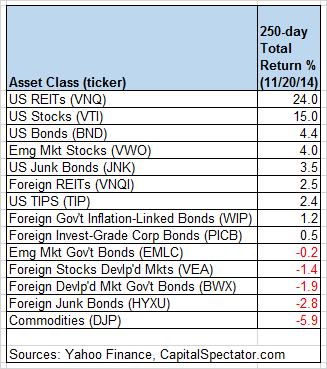
In the horse race among the major asset classes, there’s not much competition for first place at the moment. US REITs remain in the lead for the trailing one-year period (250 trading days), and by a wide margin, based on our standard list of ETF proxies for the key slices of global markets. In other words, US stocks have been demoted recently to second place, and by more than a trivial degree. Vanguard Total Stock Market ETF (VTI), which tracks a broad measure of US equities, is still sitting on a handsome gain for the past year (+15.0%), but it’s well below the 24% surge for Vanguard REIT ETF (VNQ).
VNQ’s increase is all the more striking when you consider that the rest of the field below US equities has suffered mediocre-to-negative results over the past year. Note that roughly one-third of the ETFs in the table below suffer losses for the trailing 250-day period. The current lineup is a reminder that the abundance of price gains that prevailed earlier in 2014 has subsequently faded into a more nuanced profile for the capital and commodity markets.
Here’s a graphical recap of the relative performance histories for each of the major asset classes for the past 250 trading days via the ETF proxies. The chart below shows the performance records through Nov. 20, 2014, with all the ETFs rebased to a starting-value of 100:

Next, let’s review an ETF-based version of an unmanaged, market-value-weighted mix of all the major asset classes — the Global Market Index Fund, or GMI.F, which is comprised of all the ETFs in the table above. Here’s how GMI.F stacks up for the past 250 trading days through Nov. 20, 2014. This investable strategy is up 5.8% over that span — well below the performance for US stocks (VTI) but moderately higher than the trailing return for a broad measure of US bonds (BND).

Comparing the median dispersion of the returns for the major asset classes via ETFs suggests that the general rebalancing opportunity remains muted for GMI.F vs. recent history. The dispersion of 250-day returns for our set of ETF proxies is near the lowest levels posted for the past year. Analyzing the components of GMI.F with a rolling median absolute deviation based on one-year returns for the ETFs — the GMI.F Rebalancing Opportunity Index, as it’s labeled on these pages — suggests that there’s limited potential for adding value by reweighting this portfolio in comparison with recent history. Keep in mind that the opportunity for productive rebalancing will vary depending on the choice of holdings and historical time window. In addition, don’t overlook the possibility that any given pair of ETFs may present a substantially greater or lesser degree of rebalancing opportunity vs. analyzing GMI.F’s components collectively, which is the methodology that’s reflected in the chart below.

Finally, let’s compare the rolling 1-year returns for the ETFs in GMI.F via boxplots for a revealing comparison of price momentum. The gray boxes in the chart below reflect the middle range of historical 250-day returns for each ETF—i.e., the 25th to 75th return percentiles. The red dots show the current return (as of Nov. 20) vs. the 250-day return from 30 trading days earlier (blue dots, which may be hiding behind the red dots in some cases). The general message is that positive return momentum has become a rare gem once again.

Disclosure: None.

Comments
 No Thumbs up yet!

