
Other Perspectives On The New Bond Market Conundrum
Last week I commented on a puzzling phenomenon in bond markets this year– long-term rates have been falling at the same time that nearer-term rates have been rising. Bruegel has a review of some of the discussion of this around the web.
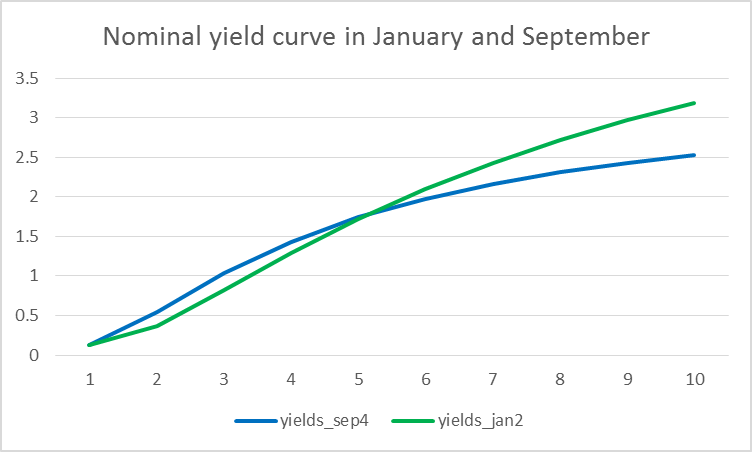
Nominal yields on different U.S. Treasury securities as a function of years to maturity as of January (green) and September (blue) of 2014. Data source: Adrian, Crump, and Moench.
The same shifts are seen in both the nominal yield curves (above) and the real yield curves (below). The interpretation I offered is that the higher near-term rates reflect the perception that the time when the Fed begins raising short-term rates (likely some time next year) is now less far away that it was in January, while growing pessimism about longer term growth prospects may account for falling longer term yields. However, this interpretation is difficult to reconcile with this year’s strong stock market.
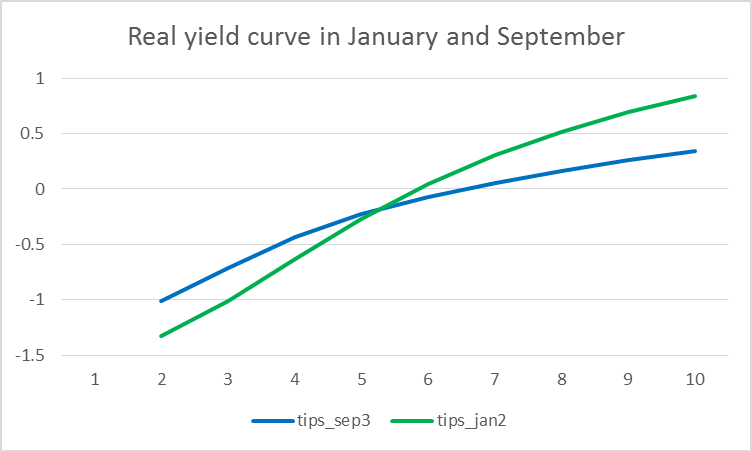
Real yields on different U.S. Treasury Inflation Protected Securities as a function of years to maturity as of January (green) and September (blue) of 2014. Data source: Gürkaynak, Sack, and Wright.
My interpretation assumed that the changing yield curve largely reflects changing expectations about future rates. But we know that another important component of the yield curve is the term premium, an added compensation you can expect to receive if you are willing to tie up your money long term. I provided a simple correction for term premia in my discussion last week. David Beckworth looked at some more sophisticated estimates of term premia developed by Adrian, Crump, and Moench. These suggest that term premia on all bonds have fallen significantly this year, with the changing 5-year 10-year differential largely explained by the fact that term premium on the 10-year bond has fallen more than that on the 5. However, this basically just passes the puzzle over to the unanswered question of why the term premium on longer-term bonds should have fallen so much more than that on short-term securities at the same time that the Fed is winding down its purchases of longer-term securities. Below I plot the contribution of term premia to the yield on each security as inferred by the Adrian, Crump, and Moench methodology.
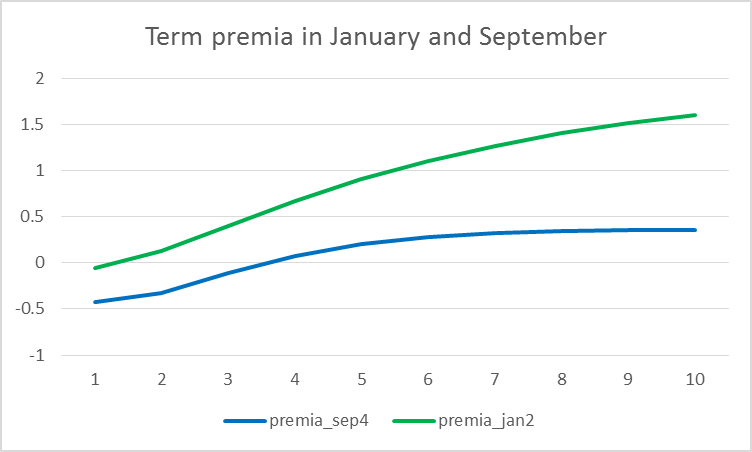
Term premia on different U.S. Treasury securities as a function of yield to maturity as of January (green) and September (blue) of 2014. Data source: Adrian, Crump, and Moench.
Unfortunately, separating the contribution of term premia is not that easy to do. The basic idea is to form a model to form a good forecast of future short-term rates, and interpret the difference between the observed bond yield and the discounted value of the model’s expected future short rates as the term premium. But different reasonable approaches to forming those forecasts can result in very different assessments of movements in term premia. The figure below shows that various approaches can differ wildly in terms of the answer they give.
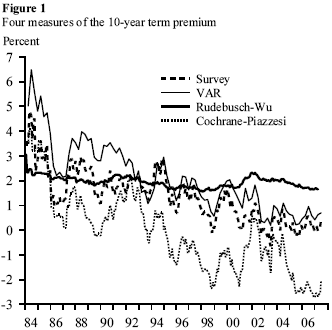
Term premium component of the yield on 10-year Treasury security as inferred from 4 different methods. Source: Swanson (2007).
Econbrowser reader JBH also called attention to the fact that the yield on long-term German bonds has fallen even more dramatically this year than U.S. Treasuries, suggesting that some of the source for the flattening U.S. yield curve could be global.
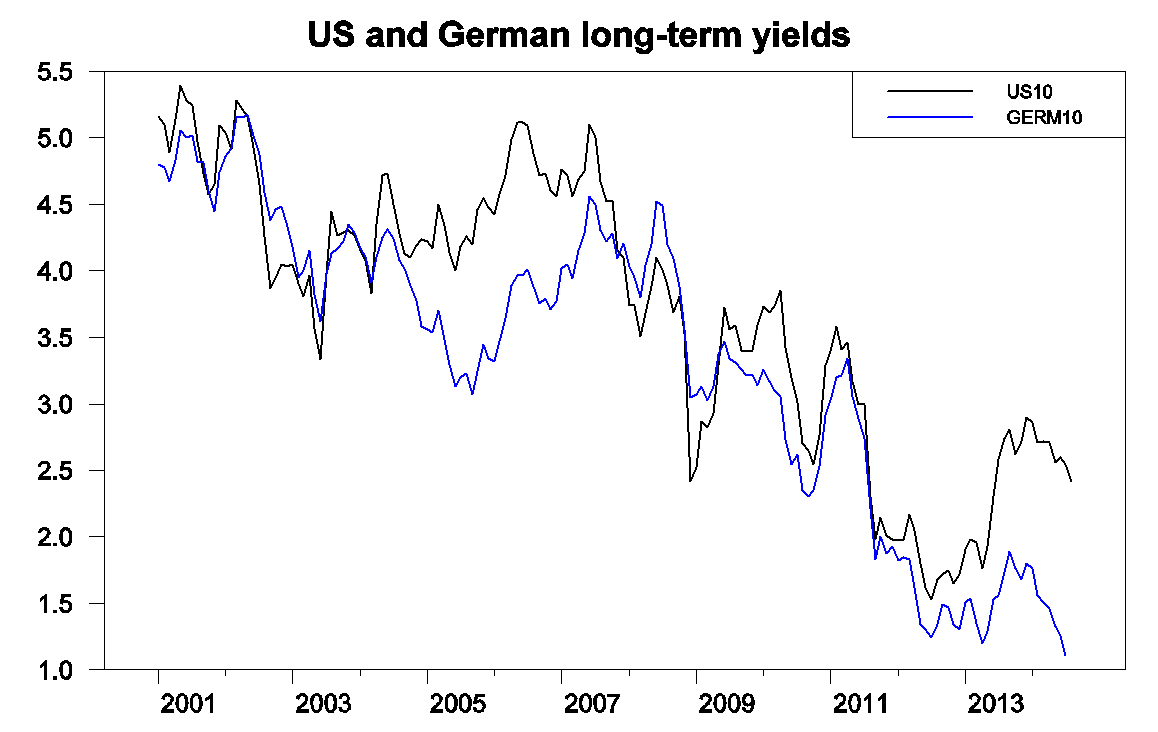
Yields on 10-year U.S. Treasuries (black) and long-term German bonds (blue), monthly, Jan 2001 to July 2014. Data source: ECB.
Robin Harding and Michael McKenzie note in the Financial Times how unusual this year’s divergence between the U.S. 5-year and 10-year rates is. I did a calculation related to theirs, looking at the correlation between monthly changes in the 5- and 10-year rates over 12-month periods. This correlation today is the lowest it’s been in the last 30 years.

Zero-mean correlation over 12-month period ending at each date between monthly change in 5-year and 10-year rates.
On the other hand, the co-movement between U.S. and German yields this year has not been that unusual. For example, in 2011, the two moved together much more closely than they have this year.

Zero-mean correlation over 12-month period ending at each date between monthly change in yield on 10-year U.S. Treasury bond and that on long-term German bond.
To the extent that Europe’s long-term prospects have dimmed, perhaps investors are willing to accept a lower real return on long-term investments in the United States, and this may account for part of the puzzle. And if the market expects the Fed to start raising rates sooner than the weak world economy warrants, that may account for some of the unusual behavior of the 5-year rate relative to the 10-year rate.
Disclosure: None.


