
Profit Margins And Major Stock Market Peaks
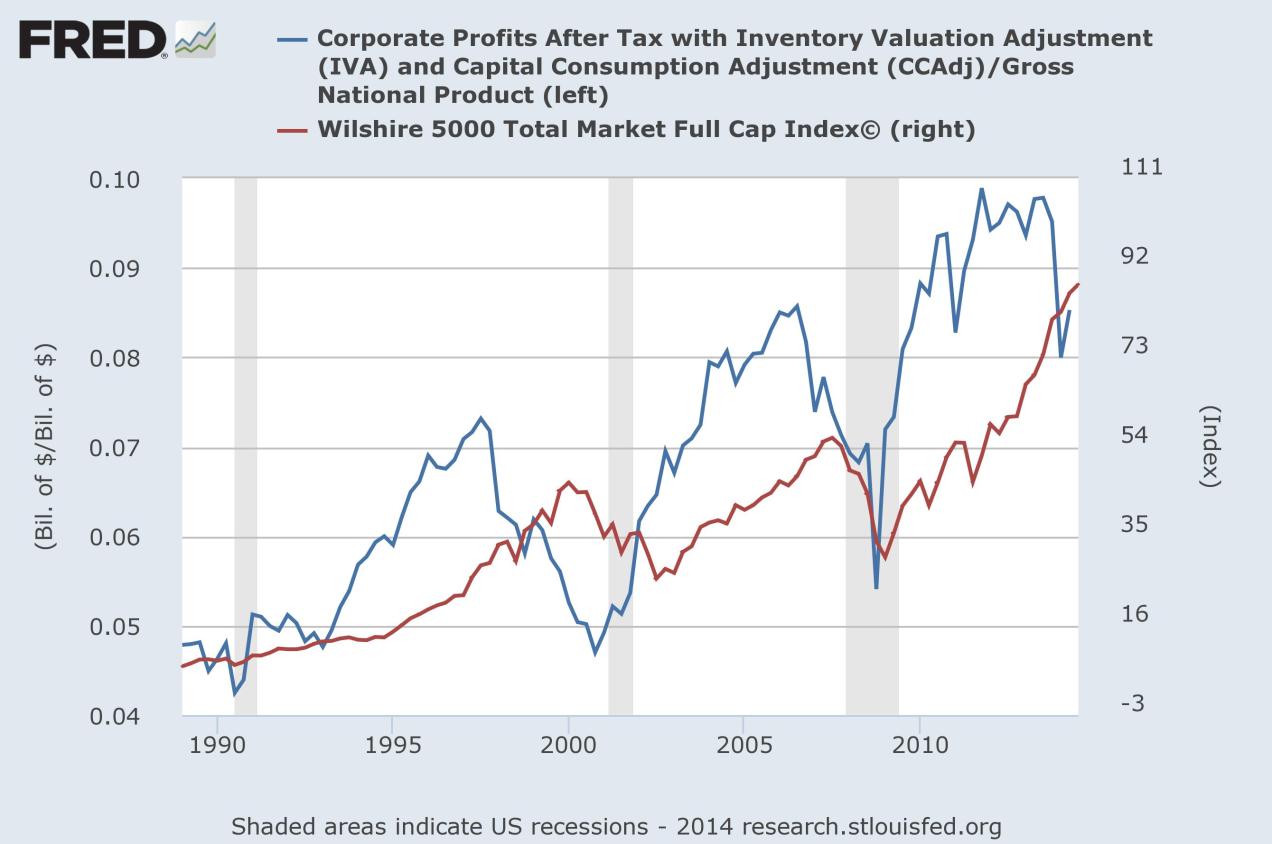
The chart above plots corporate profit margins as a percent of GNP alongside the Wilshire 5000 Index. I ran it because I was curious to look at profit margin cycles and how they relate to stock market cycles.
It’s probably an understatement to say that the current bull market has had a strong profit margin tailwind. Margins in this cycle have surged to all-time record highs. This has amounted to what could be considered rocket fuel for valuations, which are now, according to some measures, as stretched as they have ever been:

Looking back through history, it’s interesting to note that each of the major peaks in the stock market over the past 40 years has been preceded by a peak in profit margins.
In 2007, the stock market peaked about four quarters after profit margins did. In 2000, stocks peaked about ten quarters later. Stocks peaked about eight quarters after profit margins leading up to the 1987 crash. The only outlier I found (I admit it’s a small sample size) was the 1973-74 bear market where profit margins and stocks peaked simultaneously.
How is this relevant to today’s market? Well, profit margins peaked this cycle way back during Q3 of 2011 (eleven quarters ago) but they never really dropped much until Q1 of this year.
I have argued that a reversion in profit margins poses the “dominant risk” to stocks. Now that they seem to be reverting, we will soon find out if that’s true.
Disclosure: Information in “The Felder Report” (TFR), including all the information on this website, comes from independent sources believed reliable but accuracy is not guaranteed and ...
more

