
Q3:2014 US GDP Nowcast: +2.5% | 25 August 2014
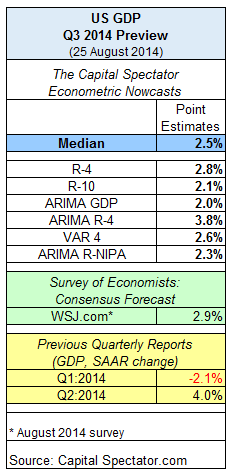
The surprisingly strong rebound in second-quarter GDP growth will suffer a substantial bout of deceleration in the third quarter, according to the Capital Spectator’s median econometric nowcast. The US economy is projected to increase 2.5% (real seasonally adjusted annual rate) in the July-through-September period, down from the 4.0% rate reported by the Bureau of Economic Analysis (BEA) for Q2.
The current nowcast is a preliminary estimate, of course, and one that’s based on limited data for Q3. The optimistic view is that the incoming numbers will improve between now and October 30, when the BEA will publish its “advance” GDP report for Q3. Based on the figures available today, however, the case for expecting that the next batch of GDP numbers will echo the upbeat Q2 data is a bit wobbly.
Meantime, looking backward still inspires hope for something better, and that’s not expected to change in this week’s round of updated GDP numbers. BEA is scheduled to release its second GDP estimate for Q2 on Thursday (Aug. 28) and the consensus forecast sees the growth rate sticking to the 4.0% rate, according to Breifing.com’s survey of economists.
As for looking ahead, many analysts anticipate slower growth for Q3. The August edition of The Wall Street Journal’s economic survey, for instance, projects growth of 2.9% for July through September.
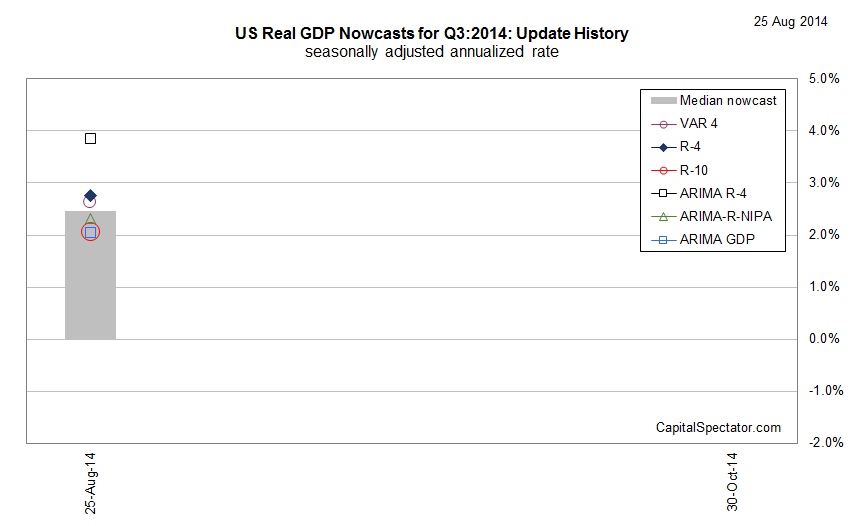
For additional perspective on the outlook, here’s a graphical review of how The Capital Spectator’s updated Q3 nowcast compares with recent history and forecasts from other sources:

Next, let’s review the individual nowcasts that are used to calculate the median estimate:
As updated nowcasts are published, the chart below will track the changes for context in assessing how the projections are evolving.
Finally, here’s a brief profile for each of The Capital Spectator’s GDP nowcast methodologies:
R-4: This estimate is based on a multiple regression in R of historical GDP data vs. quarterly changes for four key economic indicators: real personal consumption expenditures (or real retail sales for the current month until the PCE report is published), real personal income less government transfers, industrial production, and private non-farm payrolls. The model estimates the statistical relationships from the early 1970s to the present. The estimates are revised as new data is published.
R-10: This model also uses a multiple regression framework based on numbers dating to the early 1970s and updates the estimates as new data arrives. The methodology is identical to the 4-factor model above, except that R-10 uses additional factors—10 in all—to nowcast GDP. In addition to the data quartet in the 4-factor model, the 10-factor nowcast also incorporates the following six series: ISM Manufacturing PMI Composite Index, housing starts, initial jobless claims, the stock market (Wilshire 5000), crude oil prices (spot price for West Texas Intermediate), and the Treasury yield curve spread (10-year Note less 3-month T-bill).
ARIMA GDP: The econometric engine for this nowcast is known as an autoregressive integrated moving average. This ARIMA model uses GDP’s history, dating from the early 1970s to the present, for anticipating the target quarter’s change. As the historical GDP data is revised, so too is the nowcast, which is calculated in R via the “forecast” package, which optimizes the parameters based on the data set’s historical record.
ARIMA R-4: This model combines ARIMA estimates with regression analysis to project GDP data. The ARIMA R-4 model analyzes four historical data sets: real personal consumption expenditures, real personal income less government transfers, industrial production, and private non-farm payrolls. This model uses the historical relationships between those indicators and GDP for projections by filling in the missing data points in the current quarter with ARIMA estimates. As the indicators are updated, actual data replaces the ARIMA estimates and the nowcast is recalculated.
VAR 4: This vector autoregression model uses four data series in search of interdependent relationships for estimating GDP. The historical data sets in the R-4 and ARIMA R-4 models noted above are also used in VAR-4, albeit with a different econometric engine. As new data is published, so too is the VAR-4 nowcast. The data sets range from the early 1970s to the present, using the “vars” package in R to crunch the numbers.
ARIMA R-NIPA: The model uses an autoregressive integrated moving average to estimate future values of GDP based on the datasets of four primary categories of the national income and product accounts (NIPA): personal consumption expenditures, gross private domestic investment, net exports of goods and services, and government consumption expenditures and gross investment. The model uses historical data from the early 1970s to the present for anticipating the target quarter’s change. As the historical numbers are revised, so too is the estimate, which is calculated in R via the “forecast” package, which optimizes the parameters based on the data set’s historical record.
Disclosure: None.


