
Rail Week Ending 15 November 2014: Another Soft Week Inside A General Growth Cycle
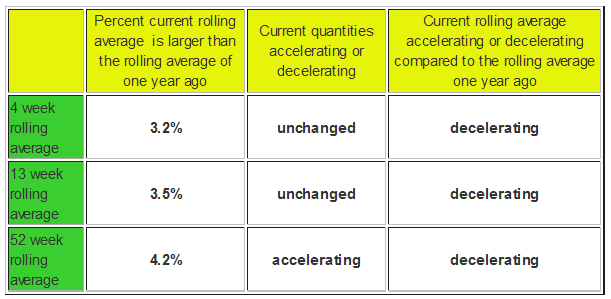
Econintersect: Week 46 of 2014 shows same week total rail traffic (from same week one year ago) grew according to the Association of American Railroads (AAR) traffic data. Rail growth this week continues to demonstrate an improving economy - but the rate of growth softened in all of the rolling averages reported below. Rail counts are growing at approximately the same rate as the economy when viewing year-over-year.

This analysis is looking for clues in the rail data to show the direction of economic activity - and is not necessarily looking for clues of profitability of the railroads. The weekly data is fairly noisy, and the best way to view it is to look at the rolling averages which generally are in a general growth cycle.
A summary of the data from the AAR:
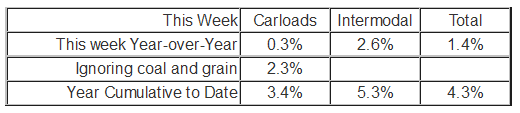
The Association of American Railroads (AAR) today reported increased U.S. rail traffic for the week ending Nov. 15, 2014 with 296,655 total carloads, up 0.3 percent compared with the same week last year. Total U.S. weekly intermodal volume was 273,695 units, up 2.6 percent compared with the same week last year. Total combined U.S. weekly rail traffic was 570,350 carloads and intermodal units, up 1.4 percent compared with the same week last year.
Four of the 10 carload commodity groups posted increases compared with the same week in 2013, led by nonmetallic minerals with 37,297 carloads, up 9.6 percent. Commodity groups that posted decreases compared with the same week in 2013 were led by grain with 23,313 carloads, down 3.9 percent.
For the first 46 weeks of 2014, U.S. railroads reported cumulative volume of 13,425,089 carloads, up 3.4 percent compared with the same point last year, and 12,003,887 intermodal units, up 5.3 percent from last year. Total combined U.S. traffic for the first 46 weeks of 2014 was 25,428,976 carloads and intermodal units, up 4.3 percent from last year.
Coal is over 1/3 of the total railcar count, and this week is 0.9% higher than the production estimate in the comparable week in 2013. The middle line on the table below removes coal and grain from the changes in the railcar counts as neither of these commodities is economically intuitive.
Current Rail Chart
Click on picture to enlarge

From EIA.gov:
For the week ended November 15, 2014:
- Estimated U.S. coal production totaled approximately 18.9 million short tons (mmst)
- This production estimate is 0.1% lower than last week's estimate and 0.9% higher than the production estimate in the comparable week in 2013
- Coal production east of the Mississippi River totaled 7.9 mmst
- Coal production west of the Mississippi River totaled 11.0 mmst
- U.S. year-to-date coal production totaled 867.6 mmst, 0.1% higher than the comparable year-to-date coal production in 2013
Disclosure: None.


