
Residential Building Sector Again Mixed In October 2014, But Long Term Growth Still Trending Down
Residential building permits were a mixed bag. Although the amount of permits was higher than completions this month - the amount of permits continues to trend down.

- The unadjusted rate of annual growth for building permits in the last 12 months has declined from a channel between 25% and 40% to a channel under 10% growth. This month was a 2.7% expansion year-over-year.
- Unadjusted 3 month rolling averages for permits (comparing the current averages to the averages one year ago) show that construction completions are clearly higher than permits. This means shortly there should be a deceleration of construction completions.
3 month Rolling Average for Year-over-Year Growth Unadjusted Data
| Building Permits | Construction Completions | |
| Current Movement | decelerating | accelerating |
Unadjusted 3 Month Rolling Average of Year-over-Year Growth – Building Permit (blue line) and Construction Completions (red line)

Econintersect Analysis:
- Building permits growth decelerated 6.4% month-over-month, and is up 2.7% year-over-year.
- Whenever permits rate of growth is lower than completions - this industry is decelerating (graph above blue line) tells the real story.
- Single family building permits expanded 6.3% year-over-year.
- Construction completions accelerated 9.5% month-over-month, up 33.1% year-over-year.
- building permits up 4.8% month-over-month, up 1.2% year-over-year
- construction completions down 8.8% month-over-month, up 8.1% year-over-year.
- the market expected:
| Annual Rates | Consensus Range | Consensus | Actual |
| Housing Starts | 0.979 M to 1.100 M | 1.028 M | 1.009 M |
| Housing Permits | 1.005 M to 1.105 M | 1.035 M | 1.080 M |
Note that Econintersect analysis herein is based on UNADJUSTED data – not the headline seasonally adjusted data.
When more building permits are issued than residences completed – the industry is expanding – and this expansion was underway for two years - until last month and this month where less permits than completions occurred. In the graph below, any value above zero shows more permits are being issued than completions.
Difference Between New Home Building Permits and Construction Completions (unadjusted)
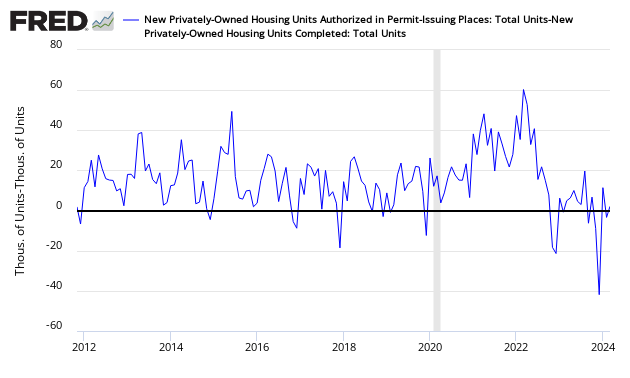
Construction completions have been growing within a narrow growth channel - but significantly rose above this channel in September 2014 but has returned to a reasonable range.
Unadjusted Year-over-Year Change New Homes -Permits (blue line) and Construction Completions (red line)

Other points to take away from the data:
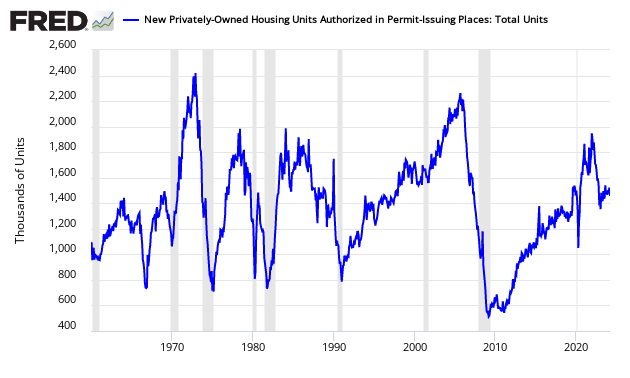
- Before we start thinking all is well, the residential home industry is about half of the pre-2005 peak.
Seasonally Adjusted Residential Building Permits
- Apartment permits (structures with 5 or more units) expanded 1.1% year-over-year (versus 10.9% expansion last month). Apartments accounted for 37.6% of all building permits, and 30.8% of construction completions.
Unadjusted Ratio Apartment Permits (structures with 5 or more units) to Total Permits – higher number means more Apartments

Caveats on the use of Building Permits Data
This is a non-monetary index. Recently, the data has had moderate downward revisions one month after initial release. Therefore, the release data this month should not be taken too seriously until next month.
This sector expands when more housing permits are issued than houses completed. The data is not necessarily accurate in real time, however. For 2011, there were more building permits than construction completions (total over a complete year) for the first year since 2005.
- 2005 = 225K more permits than construction completions
- 2006 = 140K more construction completions than permits
- 2007 = 104K more construction completions than permits
- 2008 = 214K more construction completions than permits
- 2009 = 211K more construction completions than permits
- 2010 = 47K more construction completions than permits
- 2011 = 39K more permits than construction completions
- 2012 = 181K more permits than construction completions
- 2013 = 227K more permits than construction completions
This data in this series is created by survey – not by hard data:
- Permits – A monthly survey of 9,000 selected permit-issuing places; and an annual census of an additional 11,000 permit places that are not in the monthly sample. The monthly sample of permit-issuing places was selected using a stratified systematic procedure. All permit places located in selected large metropolitan areas were selected with certainty. The remaining places were stratified by state. Places that exceed a cutoff value, which varies by state, were selected with certainty. Remaining places were sampled at a rate of 1 in 10.
- Construction Completions – To provide nationwide coverage of building activity, a multi-stage stratified random sample procedure was used to select approximately 900 building permit-issuing offices, and a sample of more than 70 land areas not covered by building permits. Each month, for permit-issuing places, a sample of residential building permits is selected from each of the sampled permit offices. The probability of selecting a permit is proportional to the number of units authorized by the permit. Permits for one-to-four-unit buildings are sampled at an overall rate of 1 in 50. All permits authorizing buildings with 5 or more housing units in the sampled permit offices are selected. Each month, for areas that do not require building permits, field representatives conduct a road canvass in each of the sampled non-permit land areas to identify the start of new buildings. All new residential buildings found are selected for the survey. Once a permit or building is selected, a field representative contacts the owner or builder, by telephone or in person, to conduct the interview each month as necessary. Contact continues until the project is either completed or abandoned. If a single-family home is not sold by the time of completion, the project will continue to be followed until the sale occurs. Each month, interviews are required for about half of the buildings currently being followed up. Each month, housing starts, completions, and sales estimates derived from this survey are adjusted by the total numbers of authorized housing units (obtained from the Building Permits Survey) to develop national and regional estimates. Estimates are adjusted to reflect variations by region and type of construction, and to account for late reports and houses started or sold before a permit has been issued. Reported data are seasonally adjusted. Monthly estimates are made for all permit-issuing places nationwide. If a survey report is not received, missing data on permits for new construction are imputed except for places that are also selected for the Survey of Construction (SOC). For these places, SOC permit data are used. We request assistance from State Data Centers to encourage jurisdictions to respond.
The US Census uses a multi-year methodology to seasonally adjust their data.Econintersectuses a simpler year-over-year analysis to seasonally adjust the data – the fear being that a major depression, government interference (incentives) in the housing markets, and other new normal effects are distorting the historical multi-year reference data.
Econintersect determines the month-over-month change by subtracting the current month’s year-over-year change from the previous month’s year-over-year change. This is the best of the bad options available to determine month-over-month trends – as the preferred methodology would be to use multi-year data (but the New Normal effects and the Great Recession distort historical data).
To say this sector is in a depression is an understatement. Please refer to the PERMIT FRED graph above.
Disclosure: None.

Comments
 No Thumbs up yet!

