
Retail Sales Continues Relatively Strong In October 2014
Retail sales improved according to US Census and slightly above expectations. Our analysis disagrees - but the unadjusted data in this series is like riding a roller coaster. Note that the 3 month rolling average of sales growth declined only marginally - and the year-over-year growth remains higher than GDP growth.

Econintersect Analysis:
- unadjusted sales rate of growth decelerated 1.4% month-over-month, and up4.6% year-over-year.
- unadjusted sales 3 month rolling year-over-year average growth decelerated0.1% month-over-month to 4.5% year-over-year.
Advance Retail Sales Year-over-Year Change – Unadjusted (blue line), Unadjusted with Inflation Adjustment (red line), and 3 Month Rolling Average of Unadjusted (yellow line)

- unadjusted sales (but inflation adjusted) up 3.5% year-over-year
- backward revisions were slight;
- this is an advance report. Please see caveats below showing variations between the advance report and the "final".
- almost all areas were tailwinds this month for retail sales growth, with only electronics and gasoline stations being the headwinds month-over-month.
- seasonally adjusted sales up 0.3% month-over-month, up 4.1% year-over-year
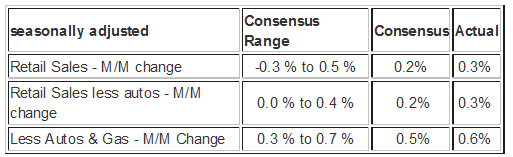
- the market was expecting:
Year-over-Year Change – Unadjusted Retail Sales (blue line) and Inflation Adjusted Retail Sales (red line)
Retail sales per capita seems to be in a long term downtrend (but short term trends vary depending on periods selected - see graph below).
Year-over-Year Change – Per Capita Seasonally Adjusted Retail Sales
From the U.S. Census Bureau press release:
The U.S. Census Bureau announced today that advance estimates of U.S. retail and food services sales for October, adjusted for seasonal variation and holiday and trading-day differences, but not for price changes, were $444.5 billion, an increase of 0.3 percent (±0.5%)* from the previous month, and 4.1 percent (±0.9%) above October 2013. Total sales for the August through October 2014 period were up 4.5 percent (±0.7%) from the same period a year ago. The August to September 2014 percent change was unrevised from -0.3% (±0.2%).
Retail trade sales were up 0.3 percent (±0.5%)* from September 2014, and 3.8 percent (±0.7%) above last year. Nonstore retailers were up 9.1 percent (±2.1%) from October 2013 and auto and other motor vehicle dealers were up 8.3 percent (±3.0%) from last year.
Seasonally Adjusted Retail Sales – All (red line), All except food services (blue line), and All except motor vehicles (green line)

The differences between the headlines and Econintersect are due to different approaches to seasonal adjustment (see caveats at the end of this post). Long and medium term trends always agree comparing the adjusted to the unadjusted data – it is the short term trends and month-over-month change where the conflict occurs.
Comparison of the Year-over-Year Census Seasonally Adjusted Retail Sales (blue line) and Econintersect’s Unadjusted Retail Sales (red line)
Declines of short duration often occur in the seasonally adjusted series without a recession resulting.
Retail and Food Services Sales – Seasonally Adjusted

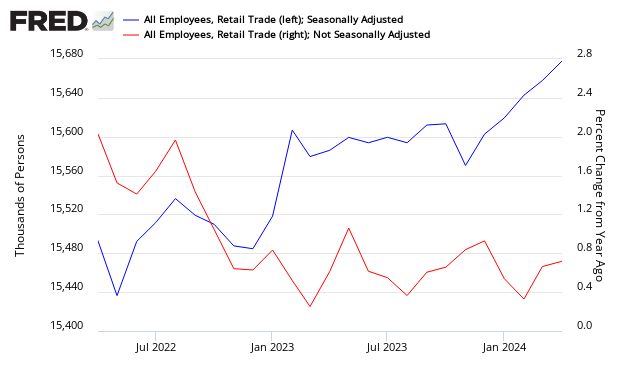
Using employment as a gauge to check growth, employment in retail has been growing - but the rate of growth recently has been slowly declining.
Retail Employment – Total Seasonally Adjusted (blue line, left axis) and Year-over-Year Change Unadjusted (red line, right axis)
And finally, as retail sales can be a component of determining a recession start date, the zero line of the graph below could be an indicator a recession was underway (or about to begin).
Retail Sales – Recession Watch Graph

Caveats On Advance Retail Sales
This data release is based on estimates. However, the estimates have proven to be fairly accurate although tend to miss at economic turning points. Therefore up to three months are subject to backward revisions, although normally slight, can sometimes be modest.
The data in this series is not inflation adjusted – and Econintersect adjusts using CPI less shelter CUSR0000SA0L2. The St. Louis Fed also inflation adjusts the Census seasonally adjusted data. The last two recessions began as the inflation adjusted retail sales crossed the zero growth line.
Comparison of Real Year-over-Year Growth between FRED’s Real Retail Sales (green line) and Econintersect’s Inflation Adjusted Retail Sales

As in most US Census reports, Econintersect does not agree with the seasonal adjustment methodology used and provides an alternate analysis. The issue is that the exceptionally large recession and subsequent economic roller coaster has caused data distortions that become exaggerated when the seasonal adjustment methodology uses more than one year’s worth of data. Further, Econintersectbelieves there is a New Normal seasonality. Using data prior to the end of the recession for seasonal analysis could provide the wrong conclusion.
The impact of the monthly retail sales data on GDP is not straight forward. Real GDP (of which the consumer is over 60%) is adjusted for inflation. Further, GDP is an analysis of quarter-over-quarter or year-over-year growth, while retail sales is a monthly data series.
Econintersect determines the month-over-month change by subtracting the current month’s year-over-year change from the previous month’s year-over-year change. This is the best of the bad options available to determine month-over-month trends – as the preferred methodology would be to use multi-year data (but the New Normal effects and the Great Recession distort historical data).
From Econintersect contributor Doug Short:
Those of us who routinely track this series know that the Advance Estimate will be followed by a second estimate next month and a third estimate the month after. How big are those revisions? Are they big enough to warrant skepticism about the Advance Estimate? Here is a visualization of the cumulative change from the first to third estimates from January 2007 through March 2014, the most recent month for which we have three data points.

Disclosure: None.


