
Robust Employment Growth
That’s the message from the BLS today.
Figure 1 shows that employment is growing, as measured by a number of indicators.
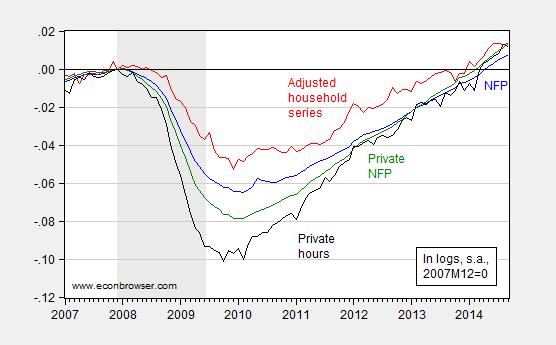
Figure 1: Log nonfarm payroll employment (blue), household series adjusted to conform to NFP concept (red), private nonfarm payroll employment (green), and aggregate weekly hours in private sector (black), all normalized to 2007M12=0. NBER defined recession dates shaded gray.
Source: BLS via FRED, BLS, NBER, and author’s calculations.
Notice further that revisions have typically been to the upside in recent months. August figures were revised upward by 69,000. This is shown in Figure 2.
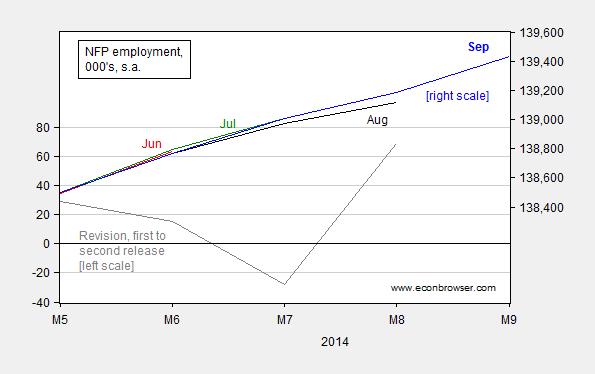
Figure 2: Level of nonfarm payroll employment from June release (red, right scale), July (green, right scale), August (black, right scale), and September (blue, right scale), and revision from first to second release (gray, left scale), all in thousands, seasonally adjusted.
Source: BLS via FRED, and author’s calculations.
One interesting point is that the labor intensity of GDP, as measured by the (log) ratio of NFP employment to real GDP has been growing more rapidly than in the preceding recovery. That is, while the ratio of employment to GDP continues to decline, the rate of decline has decelerated. This observation is illustrated in Figure 3.
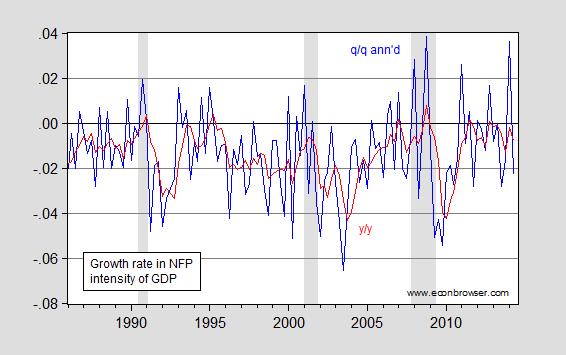
Figure 3: Growth rate in employment/GDP ratio, q/q annualized (blue) and y/y (red). NBER defined recession dates shaded gray.
Source: BLS and BEA via FRED, NBER and author’s calculations.
Of course, while the pace of employment growth has risen with output growth, the sharp drop in employment in immediate wake of the recession means that employment has caught up with that implied by the long run relationship between employment and output, as discussed in this post(the paper, with Laurent Ferrara and Valerie Mignon, is now published at Journal of Macroeconomics). That is, it’s important to remember the level as well as the growth rate, something that people sometimes forget (they know who they are). Hence, this report should not be taken as carte blanche for a rapid increase in the policy rate.
Using the correlation between log first differences between output and employment over the last six quarters (adj-R2 = 0.24), the implied growth rate for 2014 Q3 is 3.2% (SAAR), slightly higher than Macroeconomic Advisers latest tracking estimate at 2.8%.
Disclosure: None.


