
September 2014 Business Inventories And Sales Growth Is Relatively Unchanged
Econintersect‘s analysis of final business sales data (retail plus wholesale plus manufacturing) shows unadjusted sales in a tight growth range around 5.0% for the last four months. The rolling averages are unchanged from last month. This series is moderately noisy, and the real metric is likely the 3 month rolling averages.

- The unadjusted three month rolling average of business sales growth declined, .
- This is a record current dollar month for sales.
Econintersect Analysis:
- unadjusted sales rate of growth accelerated 3.6% month-over-month, and up6.1% year-over-year
- unadjusted sales (inflation adjusted) up 4.9% year-over-year
- unadjusted sales three month rolling average compared to the rolling average 1 year ago unchanged month-over-month, and is up 4.7% year-over-year.
- unadjusted business inventories growth decelerated 0.4% month-over-month (up5.2% year-over-year with the three month rolling averages decelerating), and the inventory-to-sales ratio is 1.29 which is average for Septembers during non-recessionary periods.
- seasonally adjusted sales unchanged month-over-month, up 4.1% year-over-year
- seasonally adjusted inventories up 0.3% month-over-month (up 5.3% year-over-year), inventory-to-sales ratios were up from 1.28 one year ago – and are now 1.30.
- market expectations were for inventory growth of 0.0% to 0.5% (consensus 0.3%) versus the actual of 0.3%.
The way data is released, differences between the business releases pumped out by the U.S. Census Bureau are not easy to understand with a quick reading. The entire story does not come together until the Business Sales Report (this report) comes out. At this point, a coherent and complete business contribution to the economy can be understood.
Today, Econintersect analyzed advance retail sales for October 2014. That is early data for the month following the data for this post. This is final data from the Census Bureau for September 2014 for manufacturing, wholesale, and retail:
Year-over-Year Change Manufacturing New Orders – Unadjusted (blue line) and Inflation Adjusted (red line)

Year-over-Year Growth – Wholesale Sales – Unadjusted data (blue line), Inflation Adjusted Data (red line)

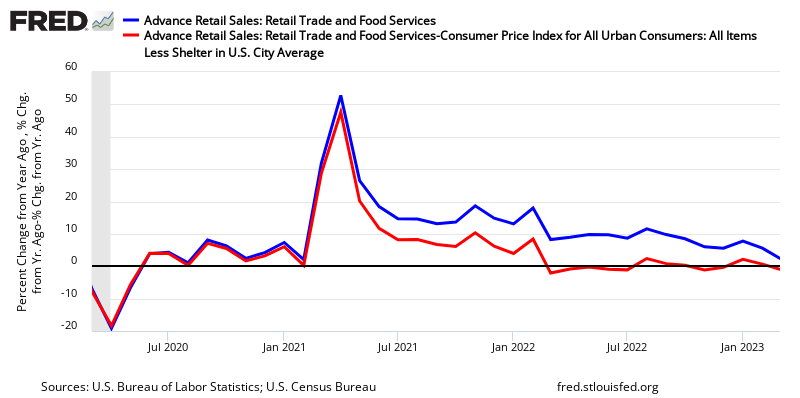
Year-over-Year Change – Unadjusted Retail Sales (blue line) and Inflation Adjusted Retail Sales (red line)
Please see caveats at the end of this post on the differences between Econintersectdata analysis methodology and U.S. Census.
Business Sales – Unadjusted – $ millions

This is a record current dollar month for sales for Augusts.
Year-over-Year Change Business Sales – Unadjusted (blue line) and Inflation Adjusted (red line)

Using inflation adjustments, analysts can more clearly count the quantity of business transactions. Inflation adjusted data accelerated.
Many analysts pay particular attention to inventories in this report. Inventories, expressed as a ratio to sales, remain well within the historical levels. A unusual rise in this ratio would suggest the economy was contracting.
Seasonally Adjusted Business Inventories Year-over-Year Change – Inventory Value (blue line, left axis) and Inventory-to-Sales Ratio (red line, right axis)

The takeaway from the above graph is that overall inventories rate of growth is slowing. The above graph is the headline view of inventories. Econintersect uses unadjusted data to look at inventories. The graph below shows the growth or contraction of the inventory-to-sales ratio year-over-year. When the graph below is above zero, inventories are building faster than sales.
Unadjusted Inventory-to-Sales Year-over-Year Change

Caveats On Business Sales
This data release is based on more complete data than the individual releases of retail sales, wholesale sales and manufacturing sales. Backward revisions are slight – and it is unusual that the revisions would cause a different interpretation of a trend analysis.
The data in this series is not inflation adjusted by the Census Bureau –Econintersect adjusts using the appropriate BLS price indices relative to the three data series.
- CPI less shelter for retail sales
- PPI subindex OMFG for manufacturing
- PPI subindex PCUAWHLTRAWHLTR for wholesale sales
As in most US Census reports, Econintersect questions the seasonal adjustment methodology used and provides an alternate analysis. The issue is that the exceptionally large recession and subsequent economic roller coaster has caused data distortions that become exaggerated when the seasonal adjustment methodology uses more than one year’s data. Further, Econintersect believes there is a New Normal seasonality and using data prior to the end of the recession for seasonal analysis could provide the wrong conclusion.
Disclosure: None.


