
'Slow Enough' Rally – Weekly Market Outlook
It was a bit of a back and forth week last week, starting bearishly, rebounding in the middle of the week, and then fizzling as trading came to a close in front of the three day weekend. When it was all said and done, however, the S&P 500 (SPX) (SPY) posted a pretty meaningless loss of 3.67 points (-0.2%).
Yet, even after three weeks of no net progress – and after three weeks of very little volatility – the market's still hanging on. In fact, the S&P 500 still has a ton of ways to stave off a major meltdown. We'll look at why and where in a moment, right after running down last week's and this week's economic numbers.
Economic Calendar
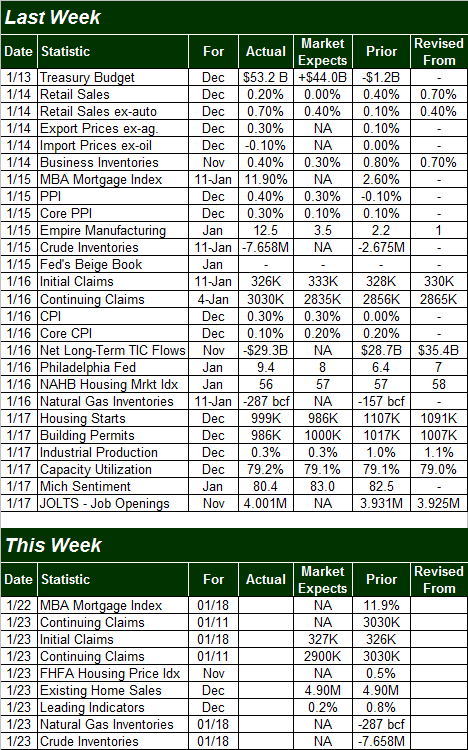
It was a pretty loaded week in terms of economic data last week, so we'll just be able to hit the highlights. They began on Tuesday, with December retail sales figures. As it turns out, although retailers were vocally concerned about weak holiday sales, the official consumer spending tally for last month was stronger than expected. Overall retail sales were up 0.2% (versus expectations of a flat comparison), and when removing automobiles from the equation, retail sales grew 0.7% (versus expectations of 0.4% growth).
On the inflation front, producer input prices grew at an annualized pace of 1.2%, up from November's 0.7% rise. F or consumers, the inflation rate now stands at 1.5%, versus November's figure of 1.24%. The approach towards deflation in the middle of last year has pretty much been averted.
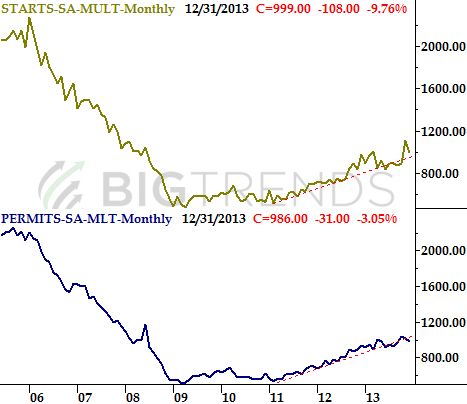
On the housing front, starts and permits were stable in December, but not higher. Seasonally-adjusted housing starts slipped from a pace of 1,107K to 999K, while issue permits slumped from 1,017K to 986K. One month of non-growth isn't that big of a deal, but these numbers have been relatively stagnant for a while.
Housing Starts and Building Permits
We'll get another round of real estate data next week… the FHFA housing price index, and the NAR's existing home sales figure. Home prices have been rising pretty consistently for months, even if sales haven't.
Finally, capacity utilization as well as industrial productivity grew – even if only by a little – last month. They're not saying growth is red hot, but at least there's growth rather than declines. We've discussed previously that there is a correlation between those 2 economic numbers and the stock market's performance.
Capacity Utilization and Industrial Productivity

Economic Calendar
The aforementioned home sales and home pricing information is the only data of any real interest for this week.
Stock Market Index Analysis
It may not have been a great week for the market, but it certainly wasn't a bad one. While the S&P 500 has been deemed lucky enough to sidestep any major pullbacks for months, one has to wonder if the market's ability avoid excessive runups has also allowed it to avoid any major corrective setbacks.
For perspective on that question, the S&P 500 has rallied 62% since October of 2011 without suffering a correction of more than 10%. That's relatively unusual… or was unusual, anyway. Perhaps the best thing the market has going for it right now, however, is that we've not seen any out-of-control surges that would invite such a big pullback; a 62% rally over the period of 26 months translates into a completely sustainable average advance of 2.4% per month.
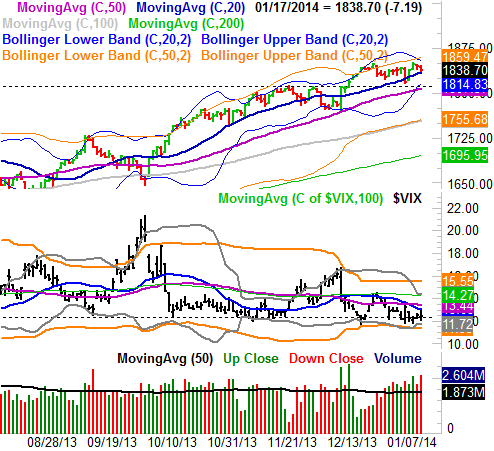
With that as the backdrop, let's start with a weekly chart of the S&P 500 today, to show just what this scenario looks like. There wasn't room to show the chart all the way back to October of 2011 when the unfettered rally began, but we got most of it in the image. We've also plotted the guidelines (black) that have framed the rally since late 2012. What's interesting is how the upper edge of the bullish zone has aligned quite well with the S&P 500's upper (weekly) Bollinger bands while the lower edge of the bullish zone has aligned nicely with the 100-day moving average line (gray). In fact, you can barely even see the upper band lines or the 100-day line because the thicker black "frame" lines are almost perfectly laid on top of them. Take a look below:
S&P 500 & VIX – Weekly Chart
So what? The so what is, while it's unlikely the S&P 500 is going to make huge progress anytime soon – since it's capped by the upper edge of a long-term trading range – it's also very likely to find support around the 1766 area, where the 100-day line and the lower edge of this rising trading range have converged for a while. Even better is the fact that the lower, support side of the trading range is rising rapidly, pushing the floor higher every day.
Now, keep the fact that there's a support level at the 100-day moving average line in mind as we drill down into the details of the daily chart…
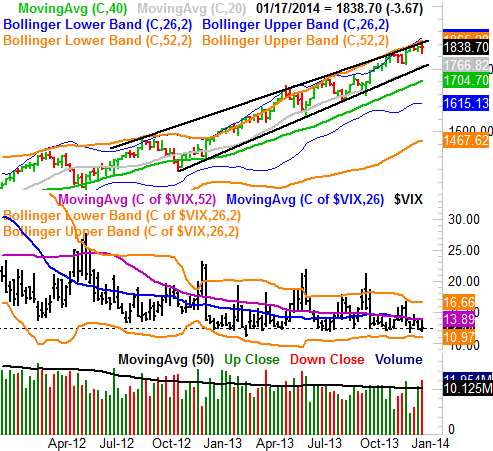
…. not that there's not a potential floor waiting for the S&P 500 well before we'd even get a chance to test that longer-term support level. The convergence of the daily chart's lower 20-day Bollinger band and the 50-day moving average line (purple) right around the 1812 (where the S&P 500 happened to find a ceiling for a few weeks in November and December). That's going to be a huge floor, and that's assuming the S&P 500 actually breaks under the 20-day moving average line (blue) at 1833. It was tested on Friday, and the index even closed below the 20-day moving average line on Monday. By and large though, the 20-day moving average line has been a huge floor for the S&P 500 for months. Until it breaks, we have to assume the bigger uptrend – even if a slow one – is still alive.
S&P 500 & VIX – Daily Chart
The X-factor here is the CBOE Volatility Index (VIX) (VXX). It's back to a rock-bottom low level around 12.30. For those who've been around the market for a few years, they'll know an ultra-low VIX is usually seen right before a major pullback, as complacency and confidence are at their highest levels right at major market tops. Those same trading veterans, however, will also have to acknowledge that for the better part of the past year, the VIX has remained remarkably low, and the S&P 500 has rallied nicely the whole time.
How'd that happen? It goes back to the "not too hot" idea.
While the S&P 500 has been bullish for more than two years, it's never been wildly bullish at any point during that time, and therefore hasn't invited any huge waves of profit-taking that would have driven a 10% correction. In that light, the low VIX has successfully predicted a low-volatility environment.
With all of that being said, it's still only a matter of time before this uber-low VIX catches up with stocks. While the bigger momentum is currently bullish, we're keenly aware that the market tends to get a little lethargic in February, even if the "best six months" doesn't officially end until we finish April and begin May. We'll still be using the same technical floors as clues of a bigger breakdown then. In the meantime, as momentum-followers, we have to cautiously remain in the bullish camp.
None.


