
Small, But Growing, Reasons To Be Concerned Here – Weekly Market Outlook
Stocks may have technically made a fourth straight weekly gain last week, but the real story was the incredibly quiet, flat market action. We'll delve into overall stock market index analysis, and some factors that have us concerned despite the overall bullish trend momentum picture, after we take a look at the recent and upcoming economic releases.
Economic Data
While there was a moderate amount of economic data to work through last week, truthfully, only a couple of items were of any real consequence.
First and foremost, last month's retail sales weren't great. They weren't bad. They just weren't great. Analysts were expecting a 0.6% improvement of retail spending overall (with or without automobiles), but we only saw a 0.3% uptick (again, with or without automobiles). That being said, a closer look at the details reveals that super-cheap oil and therefore super-cheap gas were the chief culprits for the shortcoming. Had it not been for the plunge in petrol prices, retail spending would have actually been up 0.5%.
Whatever the case, consumers are still doing their part – doing enough – to keep the economy humming, even if October's actual numbers were less than hoped.
The only other piece of economic data from last week worth mentioning (the weekly initial claims figures have largely become irrelevant since they misleadingly exclude a large chunk of the non-working population) was the Michigan Sentiment Index score, and even that piece of data should be taken with a grain of salt… since it's going to be revised two more times this month. To the extent it matters though, the initial November reading for the Michigan Sentiment Index was 89.4, up from October's final score of 86.9. That confidence trend has been moving upward for years, and it looks like we'll see at least one more step higher.
Economic Calendar
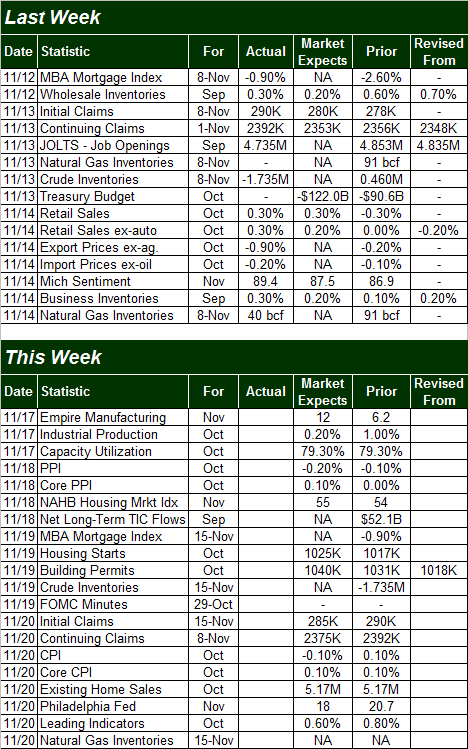
Source: Briefing.com
The coming week is not only going to be much busier on the economic data front, but a few of the data points in the lineup are hard-hitting things.
We'll get the ball rolling early on Monday, with last month's industrial productivity and capacity utilization. These may well be the best indications of the long-term market's strength (since they're so intrinsically linked to the economy), and both sets of figures have been in solid uptrends or at encouraging levels. The pros seem to be looking for a bit of a lull for last month, though as long as we don't see a major disappointment stocks should remain firm for the long haul.
Capacity Utilization and Industrial Productivity Chart
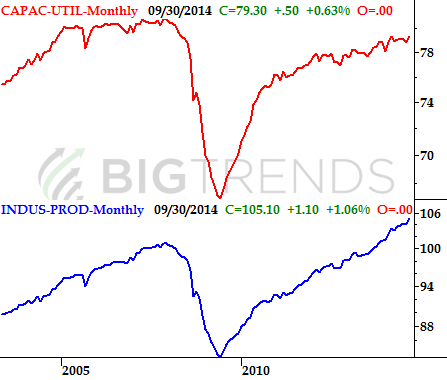
Source: Federal Reserve, chart created with TradeStation 2000i
On Tuesday we'll start a wave of inflation data, beginning with producer price inflation levels. On Thursday we'll follow up with consumer inflation levels. Economists are once again looking for tepid inflation – if not near-term deflation – for both producers and consumers. Cheap oil prices are certainly part of the cause, but that's not the only reason the inflation beast has been oddly tamed. Deflation may actually be the bigger worry.
Inflation Chart
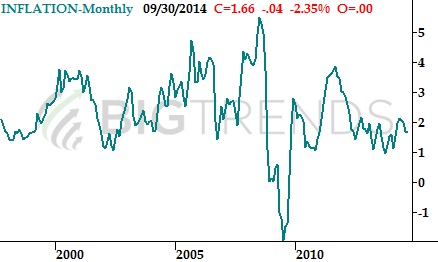
Source: InflationData.com, chart created with TradeStation 2000i
Finally, this week starts a two-week wave of real estate data. We'll hear October's housing starts and building permits on Wednesday, and existing home sales rates on Thursday. Though forecasters are basically looking for a near-repeat of September's figures for last month, bear in mind that the longer-term trend here remains an encouraging one on almost all data fronts.
Real Estate Trends Chart
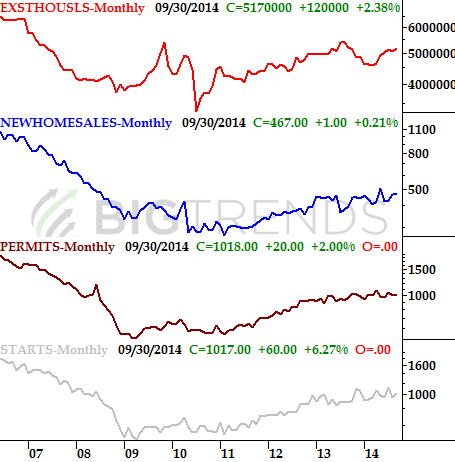
Source: Standard & Poor's, Census Bureau, and National Assn. of Realtor. Chart created with TradeStation 2000i.
Stock Market Index Analysis
Technically the market is still in a bullish trend, with the BigTrends TrendScore now stands at 97.4 (out of 100) as of the close last week. But there's some reasons to be concerned here, read on below and examine the charts.
Let's start this week's analysis with a look at the weekly chart of the S&P 500 (SPX) (SPY) — while bullish overall, what is concerning is (1) a rally with less and less participation (volume) the longer it goes on, (2) a rally that is slowing down and getting close to a complete stop, and (3) an index that's now bumping into a potential technical ceiling… the upper 52-week Bollinger band.
S&P 500 & VIX – Weekly Chart
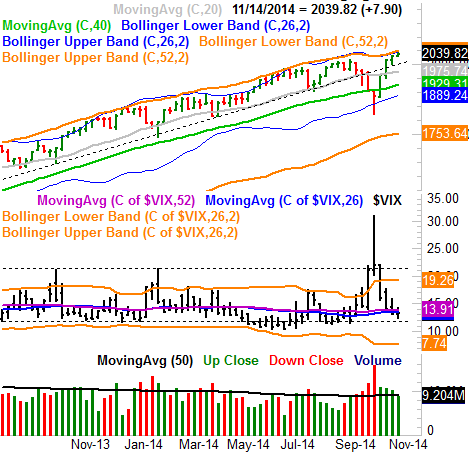
All charts created with TradeStation
Not a lot changes when we zoom into a daily chart of the S&P 500. We can see some more detail regarding the slow-down though. Namely, we can see the index hasn't budged in the past four trading days. While the holiday last week may have had something to do with this, the lack of movement is a slight concern here.
S&P 500 & VIX – Daily Chart
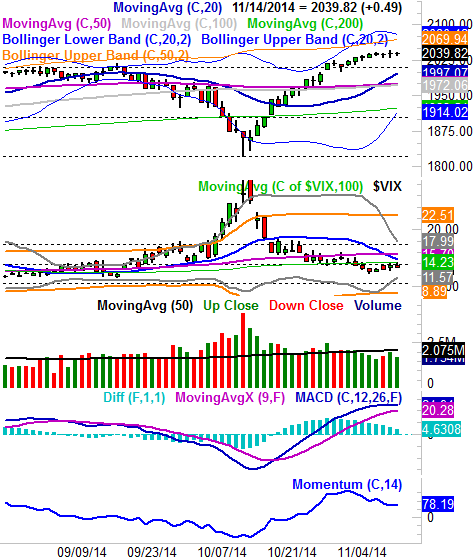
In last week's market analysis we added some MACD lines and a momentum indicator to illustrate how the rally was potentially fading. They're on the chart above. The concern here is the MACD narrowing and the Momentum indicator fading a bit. The bearish clincher on this front would be a full bearish crossunder of the MACD lines, which is actually closer than it seems.
To do that, however, the S&P 500 and the CBOE Volatility Index (VIX) (VXX) would both likely need to do some things of their own. Namely, the VIX would need to move above its recent ceiling at 15.8 and then, really, above the bigger ceiling at 17.5. Simultaneously, the S&P 500 will need break under a former ceiling at 2010 to really open the selling floodgates. We can't really make many bearish bets until we start seeing those things happen, but that doesn't mean it's time to load up on too many bullish positions, either.
Just to be clear, we're not saying the market's due to start a new bear market. Stocks are moderately overvalued though, now that the trailing P/E for the S&P 500 is at 17.75 and the forward-looking P/E is 15.75, and any stumble from here may well be the one to dole out that needed correction. Any near-term weakness may not be fundamentally-based though.
All we can really know right now is, stocks are set up for some bigger moves after last week's abnormally quiet activity. They are vulnerable to a pullback to some degree, and if the aforementioned lines are crossed, that near-term technical selloff may materialize sooner rather than later. We'll have to wait and see where the likely floor develops if the market does move lower. A bigger picture downside level to watch is 1915, should the S&P 500 fall all the way there — that's where the S&P 500's 200-day moving average line is resting, and a move to that mark would mean a 6.4% pullback from the high. But again, we're not in a bearish mode yet (in fact the overall picture is still a bullish one) — but we're seeing some small (but growing reasons) to be a bit concerned here.
Trade Well,
Price Headley
Disclosure: None.


