
Solid GDP Report
The Bureau of Economic Analysis announced today that U.S. real GDP grew at a 3.5% annual rate in the third quarter. That combines with a 4.6% annual growth rate now reported for the second quarter, giving us an average growth rate for the last six months that is solidly above the postwar average.
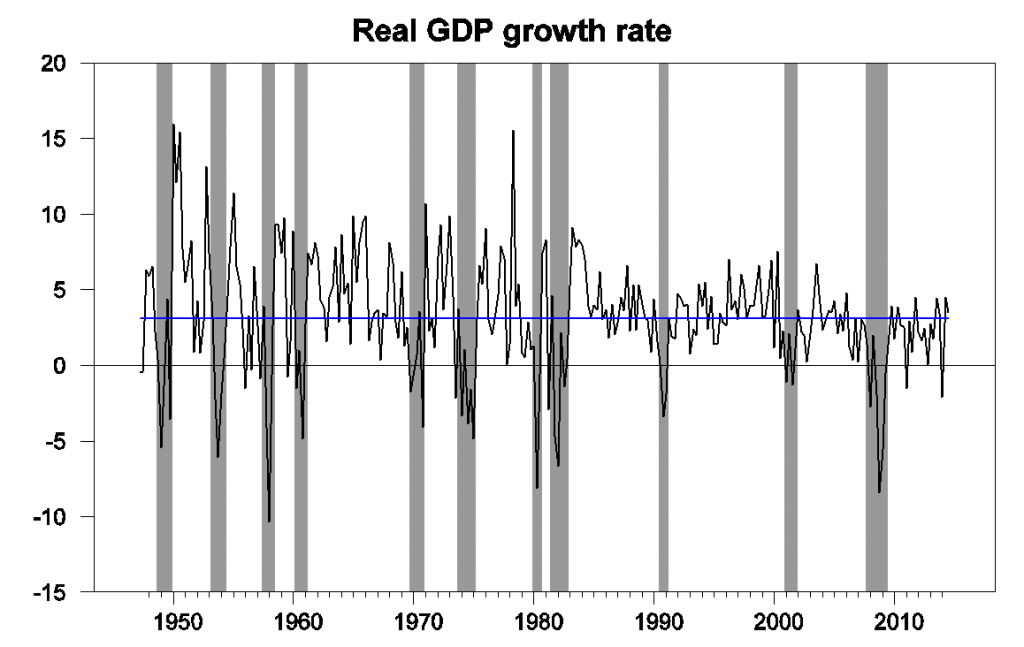
U.S. real GDP growth at an annual rate, 1947:Q2-2014:3. Blue horizontal line is drawn at the historical average (3.1%).
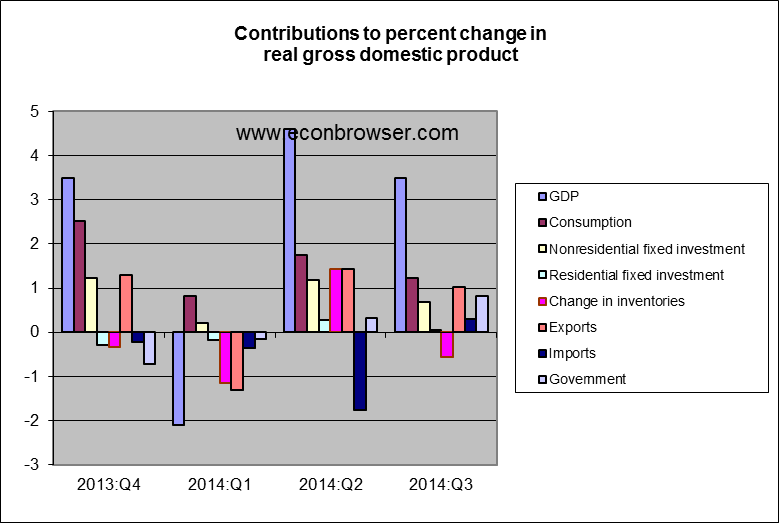
Almost all the components of GDP contributed, with solid gains in consumption, nonresidential fixed investment, and government spending. Even imports were down and exports were up, though some deterioration in that last category is a distinct possibility if concerns of a slowdown outside the U.S. prove justified. Inventory drawdown exerted a slight drag on GDP.
Our Econbrowser Recession Indicator Index, which uses today’s data release to form a picture of where the economy stood as of the end of 2014:Q2, fell back to 5.0%. The temporary spikes in the index that resulted from the falling GDP numbers for the second quarter and weak numbers for the end of 2012 look to have both been temporary aberrations. Recall that our indicator would have to rise to 67% before we would declare that a new recession had begun. Instead the data at the moment unambiguously signal an ongoing recovery.
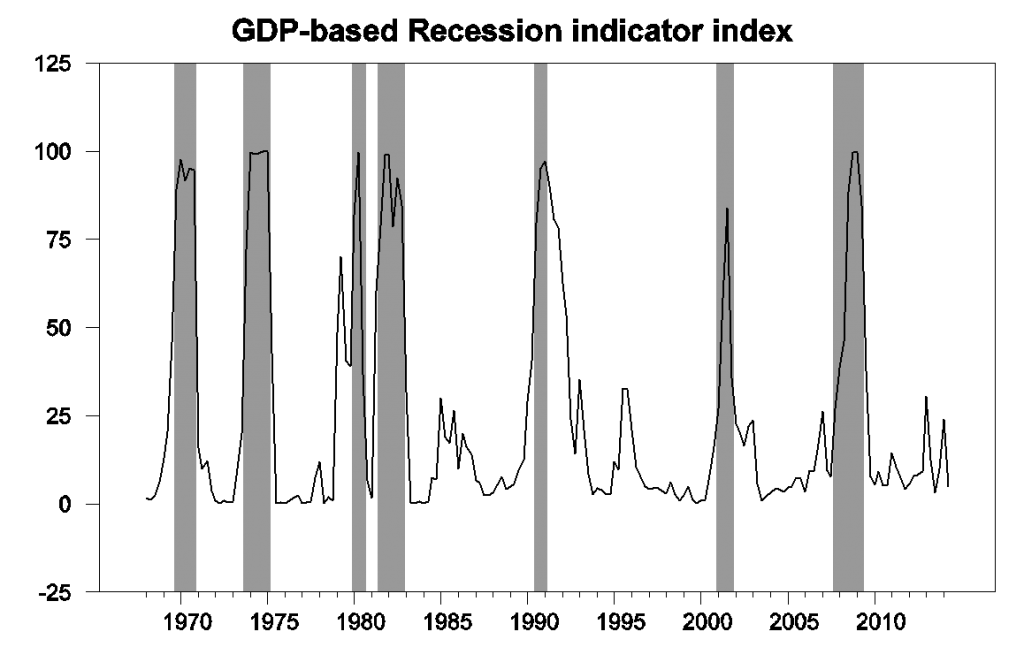
GDP-based recession indicator index. The plotted value for each date is based solely on information as it would have been publicly available and reported as of one quarter after the indicated date, with 2014:Q2 the last date shown on the graph. Shaded regions represent the NBER’s dates for recessions, which dates were not used in any way in constructing the index, and which were sometimes not reported until two years after the date.
MFR’s Joshua Shapiro had a pretty reasonable take-away:
Looking ahead, with growth abroad either slowing or already considerably slower than that of the U.S., it is highly unlikely that the net export deficit will continue to narrow. To the contrary, some retracement of third-quarter move is likely, and therefore trade ought to weigh on growth in the fourth quarter. Also, federal defense spending is unlikely to replicate its third-quarter strength in the fourth quarter. On the other hand, inventory accumulation will probably not subtract from growth as it did in the third quarter. Consumer and capital spending, meanwhile, are unlikely to vary substantially in terms of their contributions to growth. Net, net, it probably still seems reasonable to expect fourth-quarter growth in the 3.0%-3.5% range, although we will fine-tune our estimates in the coming days after having had a chance to go through today’s report in more detail.
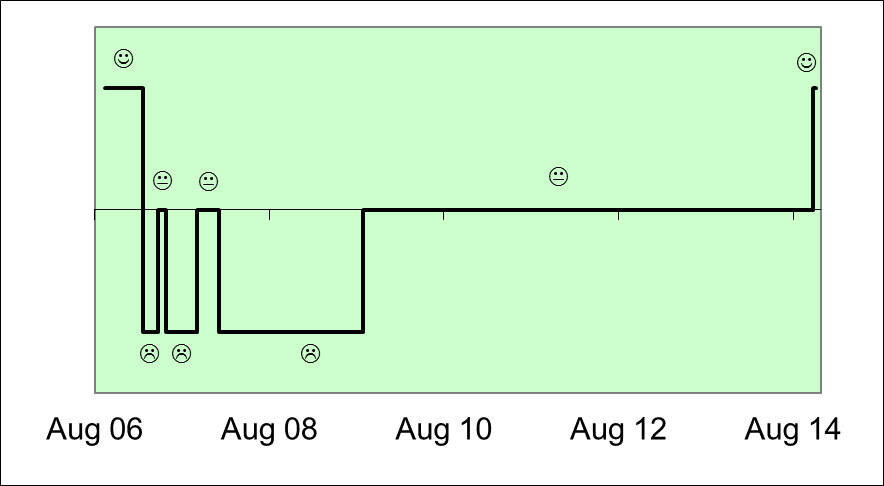
The 4% growth rate of the last 6 months may not continue, and storm clouds gathering over Europe and Japan may darken and bring at least some rain our way. But for now, I think it’s reasonable to conclude that the U.S. has entered a phase of solid but not spectacular growth. At least it’s enough to finally bring a smile to our Econbrowser Emoticon for the first time in 8 years.

Please stay tuned to this station to see how long it’s going to last.
Disclosure: None.


