
SPX Downside Targets 10% To 20% Lower Come In Focus If Weakness Continues
If the market continues lower, some clear downside targets come into view using a stripped down long-term chart of the S&P 500 Index (SPX) (SPY). A Monthly Chart of SPX with a Fibonacci Retracement from the March 2009 infamous '666' low to the recent September 2014 all-time high is below. I posted a similar chart to this a couple weeks ago, this is an even more stripped down version with a longer history to look at — and it remains relevant in the current environment.
SPX Monthly Chart with Fibonacci Retracement
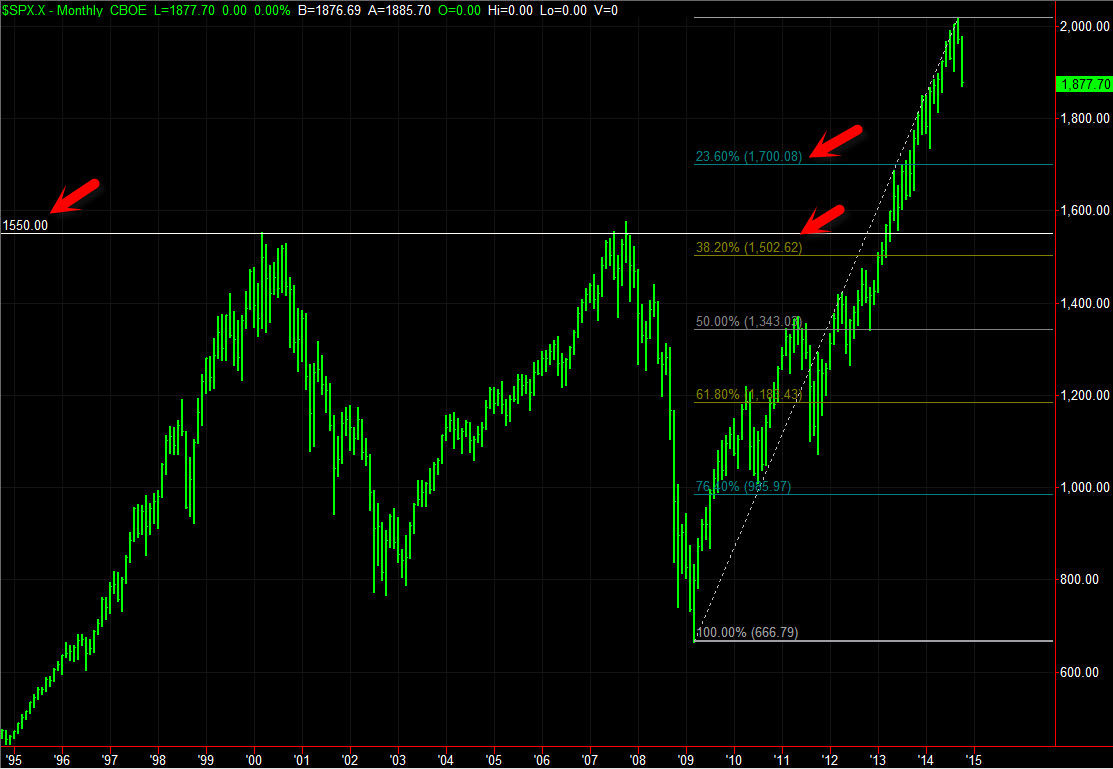
1700.08 (round off to 1700 as round levels are often important from a technical, sentiment, and psychological perspective) is the first Fibonacci Retracement level, 23.60%. That is around 9.4% lower from Wednesday's close.
Below that, there is the "double top" around SPX 1550 that formed with significant highs reached in 2000 and 2007 — also the next Fibonacci Retracement level is around the 1500 level. That area is around 17% to 20% down from recent closes.
Times like this are a good time to look at the big picture of where we've gone (and where we could come back down to) — and the market could certainly avoid further pullbacks that would take it to these targets (we've just now crossed below the simple 200 day Moving Average on the SPX — a volatile choppy consolidation around here followed by a resumption of upside is another possible scenario in my analysis).
Disclosure: None.


