
T2108 Update – A “Quiet” Divergence
(T2108 measures the percentage of stocks trading above their respective 40-day moving averages [DMAs]. It helps to identify extremes in market sentiment that are likely to reverse. To learn more about it, see my T2108 Resource Page. You can follow real-time T2108 commentary on twitter using the #T2108 hashtag. T2108-related trades and other trades are posted on twitter using the #120trade hashtag)
T2108 Status: 40.5%
VIX Status: 13.3
General (Short-term) Trading Call: Hold. Bear/bull line remains at 1962. See important developments below.
Active T2108 periods: Day #268 over 20%, Day #120 over 40%, Day #4 under 50% (underperiod), Day #15 under 60%, Day #18 under 70%
Reference Charts (click for view of last 6 months from Stockcharts.com):
S&P 500 or SPY
SDS (ProShares UltraShort S&P500)
U.S. Dollar Index (volatility index)
EEM (iShares MSCI Emerging Markets)
VIX (volatility index)
VXX (iPath S&P 500 VIX Short-Term Futures ETN)
EWG (iShares MSCI Germany Index Fund)
CAT (Caterpillar).
Commentary
The relatively quiet churn in the general market is masking two potentially important developments: an apparent bottoming in volatility and an on-going drop in T2108. The S&P 500 (SPY) ended essentially flat on the day after a big news day of GDP and another Federal Reserve decision on monetary policy. Incredibly – and I just can’t make this stuff up even if I wanted to – the S&P 500 hit a low right at the 1962 bear/bull line before bouncing to flatline.

The bear/bull line holds yet again – in picture-perfect form no less
While the S&P 500 has barely moved all month net-net, T2108 has fallen to closing and intraday lows last seen in February of this year. It is part of what has been a steep downtrend from overbought conditions that began the month. I believe that this is one of the most dramatic divergences I have seen since I started tracking T2108 many years ago. T2108 has now fallen five straight days during which the S&P 500 made a new all-time high. T2108 even looks like it is ready to plunge into quasi-oversold status. Even MORE importantly, T2108 is again on the edge of violating its higher lows for the first time since it bottomed out in oversold conditions June, 2013!
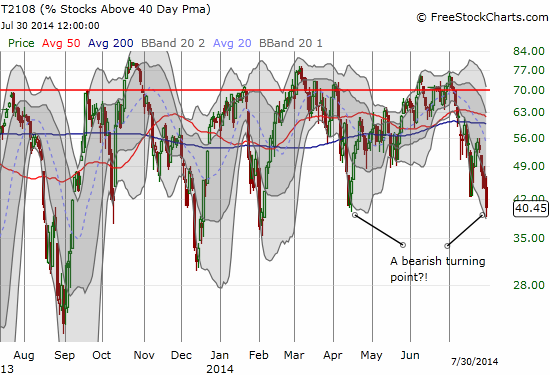
T2108 is on the verge of finally breaking a very bullish uptrend in place since June, 2013′s oversold conditions
In conjunction with this “quiet divergence”, volatility continues to look like it is bottoming. The post-Fed plunge I was looking for did not quite happen, perhaps another confirmation of bottoming. I was fortunate enough to fade ProShares Ultra VIX Short-Term Futures (UVXY) with put options on Monday’s temporary surge, but I decided to hold through the Fed decision. I am back to flat and watching developments quite intently.
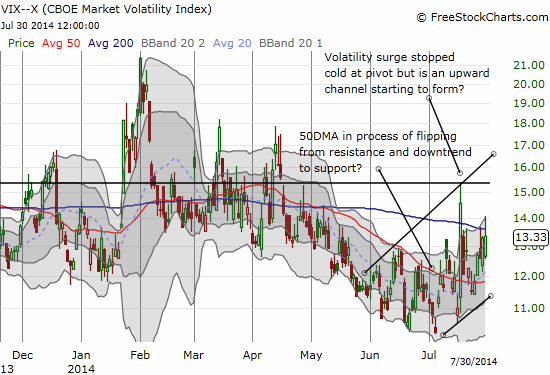
The VIX still looks like it is bottoming…
Add this quiet divergence to the high likelihood that August and September will be the weakest months of the year, and I think we get a strong case to continue the latest volatility watch and to position for a notable pullback.
The follow-through in selling on Caterpillar (CAT) seems to confirm my short-term bearish read on the stock…and it has reinforced my sense that it is time to brace for a pullback. As always, stay tuned…
Daily T2108 vs the S&P 500

Black line: T2108 (measured on the right); Green line: S&P 500 (for comparative purposes)
Red line: T2108 Overbought (70%); Blue line: T2108 Oversold (20%)
Weekly T2108

*All charts created using freestockcharts.com unless otherwise stated


