
T2108 Update – A Timely Bounce Starts Clock Ticking On Selling Pressure
(T2108 measures the percentage of stocks trading above their respective 40-day moving averages [DMAs]. It helps to identify extremes in market sentiment that are likely to reverse. To learn more about it, see my T2108 Resource Page. You can follow real-time T2108 commentary on twitter using the #T2108 hashtag. T2108-related trades and other trades are posted on twitter using the #120trade hashtag)
T2108 Status: 29.9%
T2107 Status: 49.6% (% of stocks trading above their respective 200DMAs)
VIX Status: 11.1%
General (Short-term) Trading Call: Hold (TRADERS REMAIN READY FOR WIDE SWINGS)
Active T2108 periods: Day #315 over 20% (includes day #280 at 20.01%), Day #2 under 30% (underperiod), Day #8 under 40%, Day #10 under 50%, Day #12 under 60%, Day #54 under 70%
Reference Charts (click for view of last 6 months from Stockcharts.com):
S&P 500 or SPY
SDS (ProShares UltraShort S&P500)
U.S. Dollar Index (volatility index)
EEM (iShares MSCI Emerging Markets)
VIX (volatility index)
VXX (iPath S&P 500 VIX Short-Term Futures ETN)
EWG (iShares MSCI Germany Index Fund)
CAT (Caterpillar).
Commentary
The S&P 500 SPY and the NASDAQ QQQ pulled off very timely bounces as both indices re-padded their spacing above their respective 50-day moving averages DMAS.
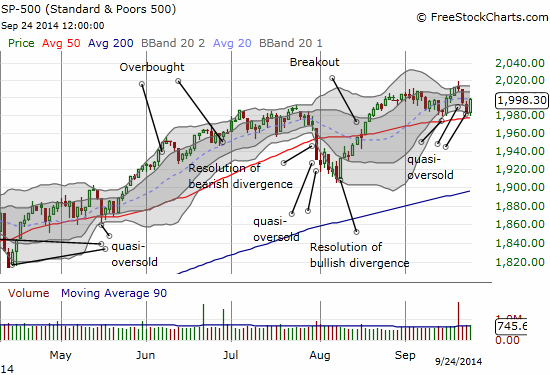
The S&P 500 successfully retests 50DMA support
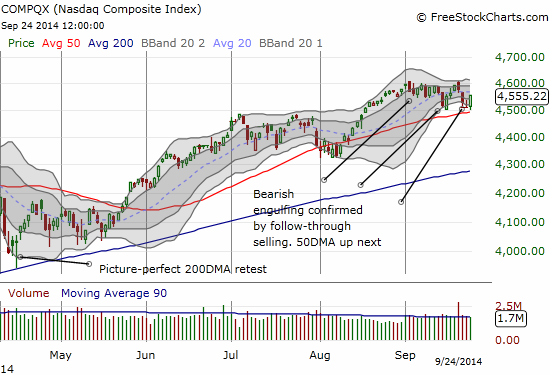
The NASDAQ successfully retests 50DMA support
Unfortunately, the T2108 Trading Model TTM did not predict the bounce despite the quasi-oversold (over-stretched) trading conditions. Moreover, a definitive catalyst failed to appeared before the bounce began to signal another 180 degree turn in thinking. Note that on an intraday basis, a daytrader could have easily justified buying a breakout to a new high on the day after the 50DMA held firm as support.
I am thinking a key lesson here is that T2107, the percentage of stocks trading above their respective 200DMAs, needs to feature more prominently in the trading model. I am now including it in the trading summary that starts each T2108 Update (see above). As I noted in the last T2108 Update, T2107 was at a low enough level to suggest that a bounce could happen at any time – I just do not have a formal model for T2107 extremes to make any definitive claims. What I CAN say now is that steep drop in the volatility index, the VIX, of 11% joined with the strong bounces off the 50DMA suggest that the clock is ticking against the latest round of selling pressure.
For example, the chart below shows that the market typically spends little time with T2108 below 30%. T2108 is on day #2 right now.
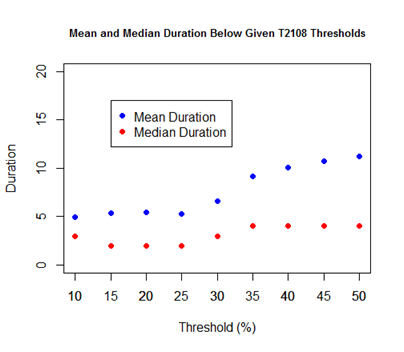
Mean and Median Duration Below Given T2108 Threshold
Another way to look at the short duration is to see the entire scatterplot of history (since 1986). In the chart below note the clustering below 10 days. Also note that the projection of the S&P 500 price change once T2108 jumps over 30% again is positive until the duration stretches toward 20 days – a rare feat for the market.
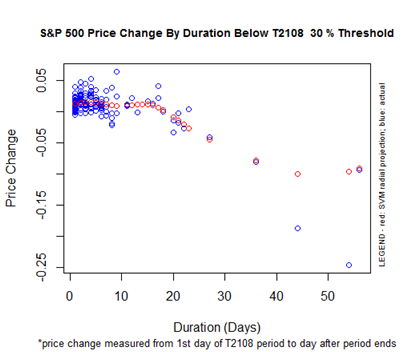
S&P 500 Price Change By Duration Below the T2108 30% Threshold
So with downward momentum abruptly coming to an end, time is now working against the bears.
I continue to play on both sides of the fence for this period of congestion and lack of overall clarity. Today’s trading gave some great examples of how this works (for more see the September 22nd T2108 Update) depending on what side of the fence (technical level) a stock is trading.
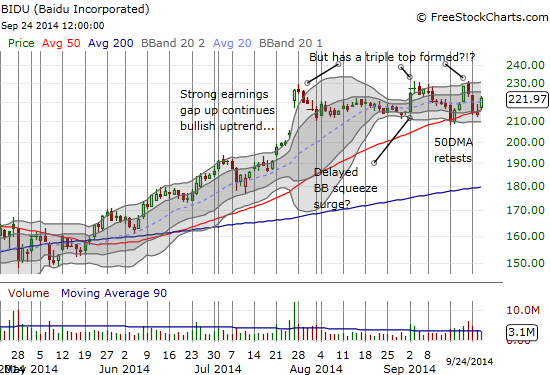
I missed today’s bounce in Baidu BIDU because I am being a bit cautious given the potential for a triple top in the stock. Otherwise, I would be all over this trade on 50DMA support.
Baidu BIDU sandwiched between bears sitting on a triple top and bulls holding up 50DMA support
I bought a fresh bunch of put options on Solar City SCTY as it bumrushed back to its 200DMA. I am assuming the breakdown on Monday confirms a triple top. So far so good on this latest bearish bet on SCTY. Note the almost perfect fade from resistance. All it needs now is confirmation…
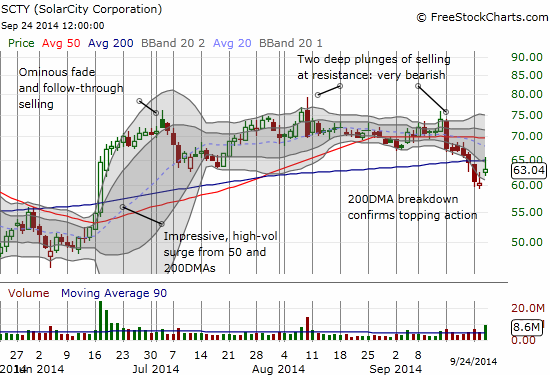
Solar City fails resistance at the 200DMA
I finally got back into LinkedIn LNKD with some call options. I like this retest of 50DMA support.
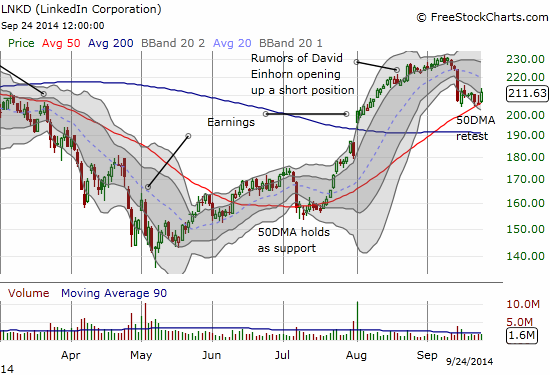
LinkedIn LNKD attempts a bounce off 50DMA support
Finally, I am made another play on Intuitive Surgical ISRG. I remain convinced that a big follow-up move is coming at some point, and I am trying to make sure I am positioned for it while lowering risk. I bought call options on Tuesday’s retest of 50DMA support. I sold today’s bounce and locked in the 65% return…too concerned that another sharp turn in the market will take the gain away as quickly as I received it.
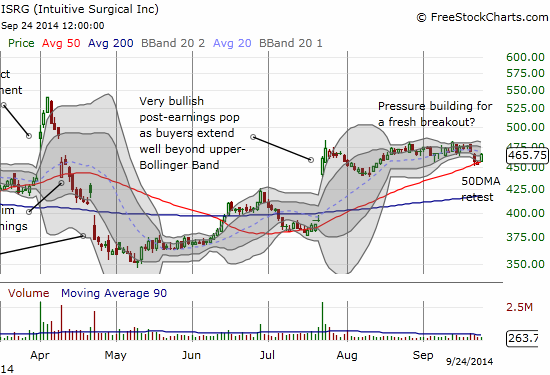
Intuitive Surgical successfully retests its 50DMA in the middle of a post gap up holding pattern
Daily T2108 vs the S&P 500

Black line: T2108 (measured on the right); Green line: S&P 500 (for comparative purposes)
Red line: T2108 Overbought (70%); Blue line: T2108 Oversold (20%)
Weekly T2108

Disclosure: Long SCTY put options.


