
The Best Home Improvement Stock: Home Depot Vs Lowe’s
The home improvement industry in North America is dominated by two major players, Home Depot (HD) and Lowe’s (LOW). For investors both Home Depot as well as Lowe’s have been very strong investments in the past, the two stocks returned 870% and 420%, respectively, over the last ten years, vastly outpacing the S&P 500’s total return of 160% over the same time frame.
The U.S. housing market thus looks quite strong right now, which poises well for home improvement retailers, as their sales are driven by both the construction of new homes as well as by renovations and upgrades that happen before or after existing homes are sold.
These tailwinds have fueled Home Depot’s and Lowe’s impressive shareholder returns over the past decade. And, both stocks pay dividends to shareholders and raise their dividends each year. Home Depot and Lowe’s are both on our list of 674 dividend-paying consumer cyclical stocks.
We will now take a closer look at Home Depot & Lowe’s, the two home improvement retailers found in the Sure Analysis Research Database, which ranks stocks based upon the combination of their dividend yield, earnings-per-share growth potential, and valuation changes to compute total returns.
Business Overview
Home Depot is the bigger of these two companies by market capitalization, sales, and profits. Home Depot was founded in 1978, is currently valued at $230 billion, and it is one of the members of the Dow Jones Industrial Average.
Home Depot operates roughly 2,300 stores in the US, Canada, and Mexico, and has revenue of more than $100 billion annually. Home Depot’s store count has grown only marginally over the last couple of years, as the company is focused on driving sales at existing locations, which is a positive for the company’s margins.
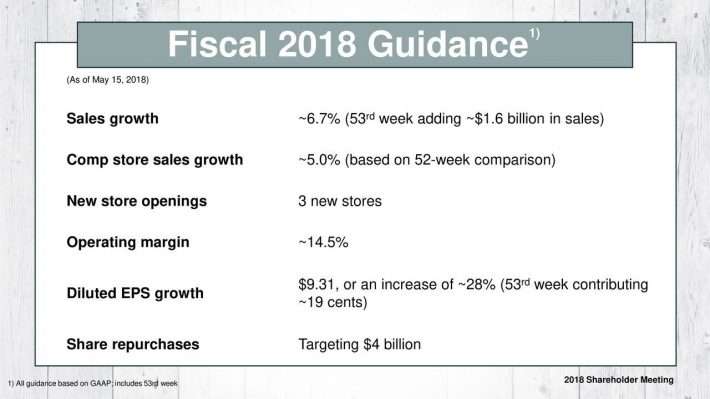
Home Depot’s most recent quarterly results were announced on May 15, the company reported revenues that grew 4.4% to $25 billion (primarily driven by a 4.2% comps growth rate) and earnings per share of $2.08, a 25% increase year over year.
(Click on image to enlarge)
Source: Home Depot Investor Presentation
Guidance for 2018 is very positive, as Home Depot forecasts $9.31 in earnings per share (a 28% increase versus 2017) and sees comps growth accelerating to 5.0% throughout the year.
Lowe’s is significantly smaller than Home Depot by market capitalization ($81 billion), but not too far behind with in terms of sales, as the company reported $70 billion in revenues over the last year. Lowe’s was founded in 1946 and operates about 2,400 stores, but average sales at its locations are lower than those at Home Depot. Lowe’s customers primarily consist of retail customers (70% of sales), whereas pro customers make up only 30% of total sales. Home Depot, which is more geared towards pro customers, has been generating a higher pace of comps sales growth.
(Click on image to enlarge)

Source: Lowe’s Investor Presentation
Lowe’s most recent quarterly results were announced on May 20, the company reported revenues of $17.4 billion (up 3% year over year), comp sales came in at only +0.6% though, the rest of the revenue increase was based on new store openings. With a lower revenue growth rate, and more of that revenue growth coming from new store openings (which is less beneficial for margin growth than comps sales increases), it is not surprising that Lowe’s earnings per share growth (+16% to $1.19 in Q1) came in at a slower pace than that of its rival Home Depot.
Growth Prospects
After the last financial crisis the housing market has been recovering successfully, the Case-Shiller Home Price Index (Composite 20) has hit a new all-time high in early 2018. Other metrics that track the health of the housing market in the US are looking positive as well, new housing permits, for example, have been trending upwards for ten years. The rate of existing home sales is close to a ten-year high, and the median existing-home price hit a record high in May.
Home Depot and Lowe’s also sell items that are not directly related to home-building or the remodeling of homes, such as lawn equipment, appliances, etc. The sales outlook for these items is less dependent on the strength of the housing market, and more related to consumer spending trends. Due to a strong economy and low unemployment consumers are able to spend an increasing amount of money: The consumer sentiment index has increased to 99 in June, which is very close to the ten-year high, and disposable incomes are in a very stable uptrend. Due to a high pace of job creation, low unemployment and 4%+ wage growth it seems likely that disposable incomes will continue to rise, which poises well for consumer spending on discretionary items such as the ones sold by Lowe’s and Home Depot.
Home Depot has recorded an earnings per share growth rate of 17% annually between 2008 and 2017, earnings per share growth even accelerated to 18% annually during the last three years. The company has forecasted an earnings per share growth rate of 28% for 2018, but this above-average growth is driven by the impact of the Tax Cuts and Jobs Act, which will significantly lower Home Depot’s tax rate. Once this effect is passed in 2019, Home Depot’s profit growth rate should decline meaningfully, yet it will remain at an attractive level according to our forecasts.
The most important factor for growing profits are rising sales at Home Depot’s existing locations, as these comps sales increases are not only the primary factor for revenue growth at the company, but they are also beneficial for Home Depot’s margins. Fixed costs for its stores (building costs, electricity, and labor to some extent) are not rising, which means that the company profits from strong operating leverage as long as it manages to increase the sales per location. This is how Home Depot was able to turn a 42% revenue increase over the last ten years into a 240% operating income increase over the same ten years.
The number of transactions at Home Depot’s stores has been declining in recent quarters (they were down 1.3% in Q1), but thanks to strong growth in Home Depot’s average ticket total comps sales are still growing at an attractive pace. Home Depot is more geared towards professionals, and average ticket size has been growing consistently in this category, as its customers make less, but bigger, trips to Home Depot’s stores.
Due to a strong housing market, a lot of building activity and consumers being able to spend increasing amounts of money on disposable items it is highly likely that Home Depot’s comps sales will continue to grow at a mid-single digits pace over the coming years. Due to the positive impact on the company’s margins that these comps sales increases will have, management also forecasts an annual tailwind from rising operating margins at a low-single digits pace.
Through a combination of comps growth (~5%), margin growth (~2%-3%), share repurchases (~2%) and some new store openings (0%-1%) Home Depot should be able to grow its profits per share by about 10% a year once 2018 (and the tax rate change impact) has passed.
Lowe’s earnings have grown by 13% a year since 2008, a slower pace than what Home Depot has managed to achieve, but Lowe’s has also been able to accelerate its earnings per share growth in the recent past, as the earnings per share growth rate averaged 18% over the last three years. 2018 will be a strong year for the company, primarily driven by tax rate changes that should propel Lowe’s earnings per share to ~$5.45, for a 24% growth rate over 2017’s total.
Lowe’s has not been generating a comps sales growth rate as high as that of its peer Home Depot, which is also why Lowe’s operating margin did not grow as much as that of its bigger peer. Due to being more focused on consumers instead of professionals this trend of a somewhat slower comps growth rate will likely persist. Lowe’s is still generating a mid-single digits revenue growth rate, but more of that growth is based on the opening of new stores, which is why Lowe’s will not benefit from fixed cost digression to the same extent as its peer Home Depot.
Through 3% comps sales growth, 2% revenue growth via new store openings, 1% of earnings growth via margin expansion and 2% of earnings per share growth thanks to the impact of share repurchases Lowe’s should be able to grow its earnings per share at a rate of roundabout 8% annually going forward, once 2018 (and its tax rate impact) has passed.
Competitive Advantages & Recession Performance
These two home improvement store operators control most of the home improvement store market in the US, and, to some extent, in Canada and Mexico. Both are not interested in engaging in any price wars, as that would hurt margins and therefore profits of both companies. Both companies operate online stores, but the majority of their sales are generated in brick-and-mortar stores. Due to the nature of the goods that are sold e-commerce is not the best choice to sell many of the items, which is also why Amazon and other online retailers are not a big threat for Lowe’s and Home Depot.
Due to being geared towards professionals more than towards consumers Home Depot is even safer from online competition (as professionals usually make bigger purchases and don’t have time to wait for delivery), and Home Depot also has been generating a better comps sales growth rate in recent years. This trend will persist, which is why Home Depot has an advantage over its peer Lowe’s.
The last financial crisis and the corresponding housing market crash did impact Lowe’s as well as Home Depot’s profits, both companies remained highly profitable, though. The earnings per share decline was relatively similar, at ~40% for both companies.
Home Depot has a liabilities to assets ratio of 90%, which looks quite high at first sight. Equity is depressed due to the company’s share repurchases, though, and when we take a closer look the company does not look overleveraged at all: Interest expenses are not that high, and thanks to strong profitability the company boosts an interest coverage ratio of 15. Home Depot’s balance sheet looks sufficiently strong for the time being.
Lowe’s has a slightly lower leverage, its liabilities to assets ratio is 83%. Due to lower returns on capital its interest coverage is lower than that of Home Depot nevertheless, though, the company earned 10 times its annual interest expenses in 2017. Lowe’s, therefore, is still financially healthy, but debt is slightly more of a concern compared to its peer Home Depot.
Valuation and Dividend Analysis
Home Depot stock trades at roughly 21 times this year’s earnings, which is a premium over Home Depot’s long-term median earnings multiple of 18.1. Shares of Home Depot, therefore, do not look extensively overvalued, but multiple normalizations over the coming years could still be a headwind for share price growth, as this could mean a drag of 3% annually on Home Depot’s total return (assuming the multiple reverts to ~18 over the coming five years).
Home Depot returns money to its owners via dividends as well as via share repurchases. Over the last couple of years, the focus has been on share repurchases (which totaled more than $8 billion during 2017), but those share repurchases were partially financed via debt. Home Depot’s management has hinted that they will slow down the rate of share repurchases (guidance for this year is $4 billion), and due to a high dividend growth rate it seems likely that dividend payments will make up the majority of shareholder returns in future years (at the current level dividend payments total $4.8 billion a year).
The dividend has grown by 21% annually over the last five years, and although the dividend growth rate will not continue to grow at that pace we forecast a dividend growth rate of roughly 10%. With buybacks totaling around $4billion a year Home Depot will be able to shrink the share count by a low-single digits pace each year.
Home Depot’s dividend yields 2.1% right now, which is slightly more than the broad market’s average, and relatively in line with Home Depot’s yield over the last couple of years. Due to a relatively high dividend growth rate and a payout ratio in the 40s Home Depot has merit as a long-term dividend growth investment.
Lowe’s trades at a lower valuation than Home Depot, which has been the case for many years – the better comps sales performance and higher earnings growth rate of Home Depot have made it the company deserving a premium over its peer. Lowe’s trades at 18 times this year’s earnings, which is marginally more than the company’s median earnings multiple over the last decade, 17.0. This means that valuation compression could be a small headwind for the company’s total returns over the coming years, with a negative impact on Lowe’s total returns of about 1% a year.
Lowe’s has returned a lot of cash to its owners via stock repurchases in the past, and, to a lesser degree, via dividend payments. Its share repurchases totaled $3 billion over the last year (equal to about 4% of its market capitalization), but Lowe’s has paid out more cash than what it generated in terms of free cash flows. Due to interest rates rising it will get more expensive for Lowe’s to finance parts of its capital returns via debt, which is why Lowe’s will most likely scale down its share repurchases the same way Home Depot plans to do.
Lowe’s is a Dividend King, with over 50+ consecutive years of dividend increases. It has a pristine dividend growth record, its payout has grown by 19% annually since 2008 and by 22% over the last three years. You can see our full list of Dividend Kings here.
We forecast that the dividend growth rate will come down to a high-single digits rate going forward to be more in line with the rate of earnings growth, although Lowe’s could theoretically keep the dividend growth rate substantially higher thanks to a relatively low payout ratio (~32%).
At 1.7% Lowe’s dividend yield is lower than that of Home Depot, and since the forecasted dividend growth rate is also marginally lower for Lowe’s, the company looks like the weaker dividend growth investment. A lower payout ratio (32% in 2018) and a longer dividend growth record are positives, but since both dividends look very safe Home Depot looks more attractive for income investors.
Expected Annual Returns
Total returns of a certain stock consist of three factors: The earnings per share growth rate of the underlying company, the direction and degree of changes in the stock’s valuation, and the dividend that is paid out to investors.
According to our estimates, Home Depot will produce earnings per share growth of 10% annually over the coming five years, together with a 3% headwind from multiple compression and a 2.1% dividend yield this will result in annual total returns of ~9% going forward.
Lowe’s will, according to our estimates, produce earnings per share growth of 8% a year, multiple compression will be a 1% headwind, and its dividend yield is 1.7%. Lowe’s will, therefore, produce annual total returns of slightly less than 9% going forward.
The total return outlook is, in total, slightly better for Home Depot right now, despite its shares trading at a higher valuation.
Final Thoughts
Neither of the two companies looks like a bad investment right here, both could produce high-single digits annual returns going forward. Home Depot looks slightly more attractive though, as it has better fundamentals, a better comps performance, a better earnings growth track record, and higher expected total returns. Due to a higher dividend yield and a higher dividend growth rate, Home Depot also looks like the better pick for income-focused investors.
Disclosure: I am long ABT, MCD, and PEP


