
The Coming Week: Start Of A Bigger Correction? Evidence & Real Danger Signals
The fundamental and technical picture, both the bullish and bearish, & tips for distinguishing between normal corrections and the big plunges. What’s driving stock indexes, forex and other global asset markets
The following is a partial summary of the conclusions from the fxempire.com weekly analysts’ meeting in which we share thoughts about what’s driving major global asset markets. The focus is on global stock indexes as these are the best barometer of overall risk appetite and what drives it, and thus of what’s moving forex, commodities, and bond markets too.
Summary
Technical Outlook- Medium Term: Trends steady, momentum neutral
Technical Outlook- Short Term: Bearish trends, momentum
Fundamental Picture: Why Is This Selloff (Not) Different From All Other Selloffs?
Fundamental Picture: The Real Danger Signals
Technical Picture
Medium Term Trends Steady, Momentum Neutral
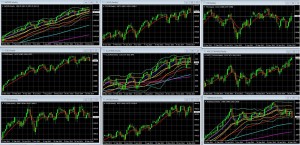
First, remember that until proven otherwise, last week’s selloff remains only that – a minor, short term dip. Our entire sample US and European indexes remain within their long term uptrends, albeit with further weakening momentum that is now mostly neutral, neither bullish nor bearish, and which suggests more range trading ahead. Our 3 Asian indexes show a more mixed picture, but only Japan’s Nikkei index looks set to log further downside, as it again closes firmly in the sell zone of its double Bollinger bands.
The Coming Week: Start Of A Bigger Correction? Evidence & Real Danger Signals
Weekly Charts Of Large Cap Global Indexes Week of December 23-Present, With 10 Week/200 Day EMA In Red: LEFT COLUMN TOP TO BOTTOM: S&P 500, DJ 30, FTSE 100, MIDDLE: CAC 40, DJ EUR 50, DAX 30, RIGHT: HANG SENG, MSCI TAIWAN, NIKKEI 225
KEY:FOR S&P 500, DJ EUR 50, Nikkei 25 Weekly Chart October 2012 – Present: 10 Week EMA Dark Blue, 20 WEEK EMA Yellow, 50 WEEK EMA Red, 100 WEEK EMA Light Blue, 200 WEEK EMA Violet, DOUBLE BOLLINGER BANDS: Normal 2 Standard Deviations Green, 1 Standard Deviation Orange
Source: MetaQuotes Software Corp, www.fxempire.com, www.thesensibleguidetoforex.com
01 Apr. 13 11.19
In sum, the technical evidence on the weekly charts suggests medium term range trading, not a breakdown.
Shorter Term Trends Suggest More Short Term Downside
Obviously the recent weakness is more pronounced on the daily charts, where shorter term movements are more immediately felt. The overall picture suggests at least a test of deeper support, though even a test down to 5 month lows would be only 7.9% correction from recent highs, well within range of normal pullbacks within longer term uptrends.
The S&P 500 daily chart below serves as a good representative of our sample of global indexes.
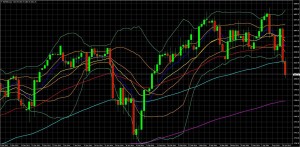
S&P 500 Daily Chart 3 December 2013 – Present
KEY: 10 Week EMA Dark Blue, 20 WEEK EMA Yellow, 50 WEEK EMA Red, 100 WEEK EMA Light Blue, 200 WEEK EMA Violet, DOUBLE BOLLINGER BANDS: Normal 2 Standard Deviations Green, 1 Standard Deviation Orange
Source: MetaQuotes Software Corp, www.fxempire.com, www.thesensibleguidetoforex.com
02 Apr. 13 11.38
With the break below support at 1825 and the 100 day EMA, there’s no further support before the 1780 area, which also has the strong support of the 200 day EMA.
Fundamental Picture: Why Is This Selloff (Not)Different From All Other Selloffs?
The financial press has been unable to agree on the cause of last week’s sell-off in most leading global stock markets and indexes.
Here’s our analysis of what drove the recent selloff and where it’s heading.
The reasons for the selloff fall into 2 categories, the fuel and the catalysts.
The Fuel: The Older Bearish Factors Awaiting A Catalyst
These are same bearish fundamentals that have made markets vulnerable to pullbacks for months. Investors knew they’d be a problem at some point, but the indexes continued to rise anyway. These would fuel a selloff but clearly hadn’t been enough of a reason to start it.
-High Valuations: Fears That Stocks Are Too Expensive And Due For A Pullback
—-Stocks are still very expensive per the most widely followed stock valuation metrics like Shiller’s CAPE (cyclically adjusted PE) and the Tobin q ratio
—-Corporate profit margins are at record highs. This is worrisome if you believe like most analysts that these are mean-reverting. There are those who argue that this assumption doesn’t apply when not in a recession. See here and here for details on the great stock valuation debate. With so many global indexes still near multiyear highs, and US indexes at record highs, uncertainty about whether stocks are in fact too expensive (and due for a major fall) is the primary reason yield starved investors have not widely participated in the recent bull market.
There have been counter arguments that also eased valuation fears.
Continued low rates continued to force yield seekers into equities
Slow recoveries would keep central banks dovish and rates low. Heck, even if the Fed started to hike, a feared spike in the 10 year T-note rate to ~3.5% is still low compared to the average yield of 6.25% from 1962-2013.
The Catalysts: What Changed Last Week
However the above threats have been around for many months.
So what sparked the past week’s selloff in global stock indexes? What were the actual new catalysts? Suspects include:
- Profit taking ahead of an anticipated lackluster Q1 earnings season. There is nothing thus far to suggest anything worse, and of course, analysts tend to set expectations lower in order to facilitate upside surprises. Therefore an upside surprise is at least as likely as a major miss for earnings season.
- Further evidence of a China slowdown (old news too, really)
- Continued signs of escalation in Russia’s Ukraine land grab. This is new. Most expected Russia to let things calm down for a while. Instead, we get another verse of the same song. Violent clashes as Russian separatists in Ukraine seize government buildings, and widespread belief that Russia is setting up another invasion pretext. The fact that Russian forces are still sitting on Ukraine’s border lend further support to this thesis.
- A self-feeding technical correction as declines in volatile tech stocks triggered computer driven selling that drove yet more selling as stop loss or profit taking points were breached for the more volatile tech stocks with big institutional ownership (so when they sell they sell a lot). We could point to the numerous ‘doji’ type candle sticks (which suggest indecision and a pullback when they appear at the top of trading range see here for details under instructors notes) for the prior week on US and European index weekly charts, but we’ve seen those before in recent months and they have not forecasted anything more than a short term minor pullback at most.
- We suspect that early pre-holiday selling may too be a contributing factor.
Thus far all this sounds like a giant “we don’t know.” It is.
There are no new fundamental drivers to suggest we’ve anything more than a normal 10-15% correction coming at worse. As noted above, we don’t even see compelling technical evidence for more than an 8% pullback.
The Real Danger Signals: What Would Signal A Major Correction?
Nor do we expect one until either one of the following happens.
New surprise contagion risks from China, or more likely, the EU
- —-Both of these are low probability events. We continue to believe the EU’s failure to even deliver a believable bank union is further proof that the EU will never get the centralize control over the EU economy that a functioning currency zone needs, because popular support for ceding control over national economies doesn’t exist.
- —-However the EU could well keep going for many more years with yet more lending printed money to those in dire straits, as long as it doesn’t have to deal with a large sovereign default. Even German officials are signaling a grudging acceptance of further easing and ultimately, wealth transfers from wealthier to poorer nations.
Global Central Bank Tightening Comes Too Soon
This too isn’t likely.
- —-The Fed continues to sound dovish and has no reason to change unless we get a big spike in inflation pressures or US growth. We’ve no compelling evidence for either of these drivers of Fed tightening.
- —-China’s PBoC is also trying to tighten but like the Fed, is moving slowly in a “one step forward half a step back” pace.
- —-The ECB has further easing ahead, and so does the BoJ.
TOP CALENDAR EVENTS
It’s a light calendar for EU and US top tier risk events, and a holiday shortened week too. However it’s the second week of Q1 2014 earnings season, and the first with a large number of top names reporting. This could be the big driver of sentiment.
- Monday: US retail sales
- Tuesday: The German ZEW survey is scheduled for release next week along with Eurozone consumer prices, current account and trade numbers. There’s US CPI too, but no big news expected from that
- Wednesday: China data dump, including GDP, industrial production, fixed asset investment, and more. EU CPI – this will matter if it shows a further slide towards deflation
- Thursday: US Philly Fed mfg index
EARNINGS
Top earnings reports include:
- Monday: Citigroup (C), American Airlines (AAL)
- Tuesday: Intel (INTC), Johnson & Johnson (JNJ), Coca Cola Co. (KO)
- Wednesday: Google Inc. (GOOG), American Express Co. (AXP), Bank of America Corp. (BAC), PNC Financial Services Group (PNC)
- Thursday: General Electric Co. (GE)
CONCLUSIONS
1. Relax
The technical and fundamental evidence suggest no more than a normal correction, probably a relatively minor one of ~8% as the S&P 500 tests the 1700 area.
Longer term, the fate of the rally hinges on:
Are stocks expensive? The valuation debate: do normally mean reverting valuation metrics like profit margins and PE ratios revert to historic means during a time of unprecedented financial repression (aka historically low rates from historically high levels of central bank stimulus).
Can central banks avoid a liquidity trap? Can central banks unwind stimulus without spiking interest rates and killing off economic recovery? For those not familiar with the liquidity trap threat, we discuss this in some detail here and here.
What To Do?
It’s the same dilemma investors have faced for years. Stocks look expensive by traditional valuation measures, but those needing yield have few other options.
For equity investors the choice is whether to:
- Stay in cash in hope of being able to catch the next big bottom, and risk lost income and even more expensive future entry points and probably lower dividend yields
- Keep buying equities despite the above risks. To minimize these, we prefer:
- dividend stocks that provide your preferred combination of yield and safety. Given that concerns about rising rates for the coming year appear overdone, those stocks that have suffered from rate spike fears (selected mREITS and MLPs) deserve investigation. These also come with a built in USD hedge given their holdings of hard asset.
- Stop losses in place. Setting stop losses involves multiple considerations, which I discuss in my book in Chapter 5, pp 142-7. You can view parts of that using the Look Inside feature on its amazon page here. Just click on the book image, then the table of contents option, then page 142
For currency investors and traders, we note that the EURUSD is now near the top of its 8 week trading range. As noted above, we see markets maintaining their trading ranges in the coming weeks, so this may be an opportune time for those seeking a new short entry around 1.39. As we discuss here, our real time sample of retail traders suggest the trade is already getting crowded.
The above is for informational purposes only, responsibility for all trading or investing decisions lies solely with the reader.


