
The Ever-Expanding Government, Revisited
John Fund, in National Review Online, writes of:
“…an ever-expanding government that chokes off economic opportunities for the middle class and those who aspire to it.
Time for some data. Figure 1 shows Federal government current expenditures normalized by the size of the economy.
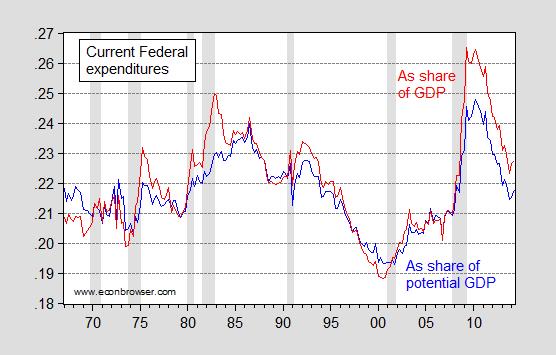
Figure 1: Federal government current expenditures as a share of GDP (red) and as a share of potential GDP (blue). NBER recession dates shaded gray. Source: BEA, 2014Q2 advance release, CBO (February 2014), NBER and author’s calculations.
Federal government expenditures are now at 22.7% of GDP, far below the 25% recorded in 1982Q4 during the Reagan administration.
One point that all can agree on — even if there is no agreement on how to deal with the issue — is the deficient level of public investment. The American Society of Civil Engineers (ASCE) provided an assessment in 2013; their current estimated funding requirement through 2020 is $3.6 trillion. Figure 2 presents real investment as a log ratio to output.
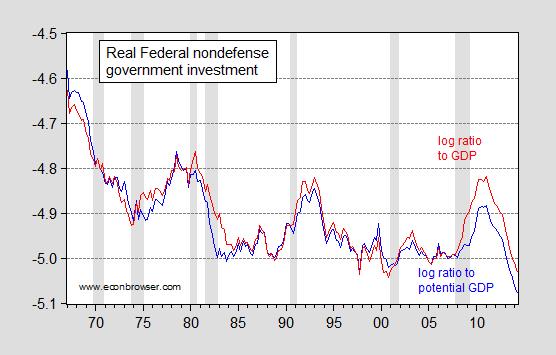
Figure 2: Log ratio Federal real government investment expenditures to real GDP (red) and to real potential GDP (blue). NBER recession dates shaded gray. Source: BEA, 2014Q2 advance release, CBO (February 2014), NBER and author’s calculations.
Note plotted are real quantities for real government investment (which includes intellectual property products, such as software). This graph can be read as follows: the log ratio of investment to GDP rose from -4.99 in 2007Q4 to -4.82 in 2011Q1, which means that real government investment grew a cumulative 17% faster than real GDP. On an annual basis, over this 3.25 year period, investment was growing 5.2% faster.
Since 2011Q1, the log ratio has plunged to -5.03, which is a cumulative decline of 21% over a 3.25 year period. On an annual basis over this period, this is a 6.5% rate of decline.
A lot of concern has focused on the decline in government investment in physical capital — bridges, roads, sewer systems, etc. That concern is focused not only on Federal investment but also state and local. I haven’t had time to generate the real investment ex-intellectual property products series, so I present in Figure 3 investment in structures and equipment as a share of nominal GDP.
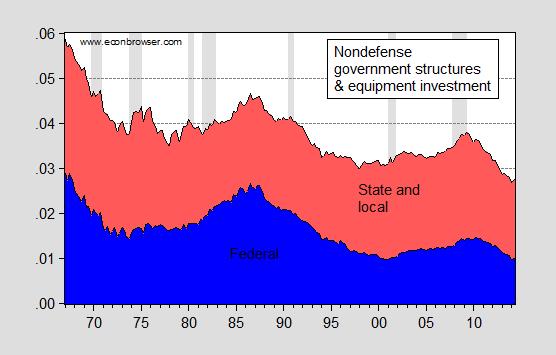
Figure 3: Federal nondefense investment in structures and equipment (blue) and state and local investment in structures and equipment (red) as a share of nominal GDP. NBER defined recession dates shaded gray. Source: BEA 2014Q2 advance release, NBER and author’s calculations.
To me, the implications are clear. With borrowing costs extremely low, it makes sense to invest in infrastructure. Some disagree. Then, the question is, are you with Barry Eichengreen or Sarah Palin? By the way, despite talk of the taper, and incipient Fed tightening, borrowing costs for the government remain quite low; this is shown in Figure 4.
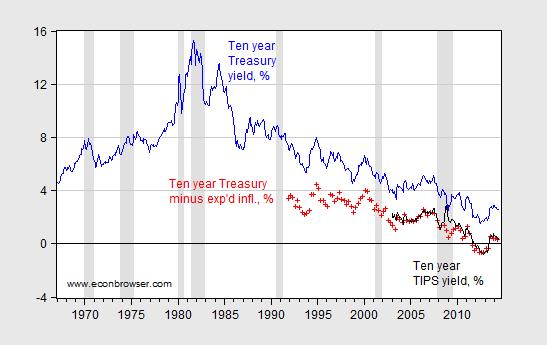
Figure 4: Ten year constant maturity Treasury yields (blue), ten year constant maturity yields minus ten year (median) expected inflation (red +), and ten year constant maturity TIPS (black). NBER defined recession dates shaded gray. Source: Federal Reserve via FRED, Survey of Professional Forecasters, and author’s calculations.
For a discussion of transportation investment needs and potential impacts, see this NEC/CEA report.
Disclosure: None.


