
The Fed’s Paint-By-The-Numbers Delusions About The Labor Market
Another “jobs Friday” brought a predictable outbreak of delighted squeals from the bubblevision commentariat. This is shaping up to be the one of the best years for jobs growth during the entire 21st century, they gushed.
Well, now. Here we are nearing the end of 2014 and the nation’s once and mighty “jobs machine” is fixing to utilize no more labor hours this year than it did way back at the end of the 20th century.
And, no, that completely unsung fact does not reflect some anomalous quirk owing to the Great Recession. We are now 64 months from the June 2009 bottom and the index of total labor hours in the non-farm business economy stands at about 108—–the same level first recorded in Q3 1999. This means that during the 21st century to date the US economy has been bicycling up-and-down an essentially consant amount of labor during the intervals between the serial financial market booms and busts engineered by our monetary politburo.
That there has been a step-change in the true employment trend is starkly evident in the two charts below. During each of the eight business cycles between 1950 and 1999, labor hours temporarily lost during the recession phase were quickly recouped during the recovery phase, and then blew through the prior peak to a sharply higher level. And this pattern recurred cycle-after-cycle. Altogether, labor hours employed by the US economy grew at a 1.7% annual rate over the 50 years period——business cycle downturns notwithstanding.
![]()
That was then. Below is now. The current so-called recovery cycle is already long-in-the-tooth by historic standards, yet we are still on the flat-line. That fact alone vastly overshadows any short-term lift that can be detected in the monthly “jobs” print.
Instead of celebrating what are plainly transitory and reversible short-term gains, someone ought to be asking what is wrong with the big picture? Most especially, the band of mad money printers who occupy the Eccles Building should be required to answer this question: After inflating the Fed’s balance sheet by an astonishing 9X during this period—–from $500 billion to $4.5 trillion—–why is it that your purported monetary elixir has not generated a single additional labor hour in the nonfarm business economy for 15 years running?
![]()
And that’s for starters! The real point here is that the monthly establishment survey “jobs” print is a crock in its own right, but the fact that it (and its companion household survey numbers) is used as the principal guide to monetary policy is the true embarrassment.
Don’t these academic mountebanks at least have a sense of humor about the ridiculous paint-by-the numbers ritual involved here? Unless the mix of jobs in the economy is absolutely frozen over long-stretches of time, the one-job-one-vote headline number doesn’t really tell anything about labor market “slack”——even if that were an appropriate object of central bank policy, which it manifestly is not.
Thus, the October print showed a 15k gain in manufacturing jobs and a 52k gain in leisure and hospitality (i.e. bar-tenders, waiters, bell-boys, ticket takers and hot dog vendors).The former jobs average about 41 hours per week at $25/hour, meaning that the annualized manufacturing wage equivalent is about $53,000. By contrast, the leisure and hospitality sector is about low wages and part-time work—-with 26 average weekly hours per job at $14/hour. That’s the equivalent of $19,000 at an annualized rate, or just 35% of the economic value of a manufacturing job.
Nor are these examples outliers. Another big gainer in October was 27k retail clerks—a category which posted 31 average hours per week at $17/hour or $27,000 at an annual rate.
Contrast that with the 2.7 million jobs reported for the “information technology” category in October. These “jobs” average 37 hours per week, $34 per hour and $65,000 per year. The trouble is, the payroll count for October declined by 4,000 jobs in this category; and this job loss trend has been consistent every since the Great Recession ended. In fact, there has been a 100k or 5% decline in the number of jobs in this high paying category since the recession allegedly bottomed in June 2009, and a 850k or 25% decline since 2000.
In short, the headline jobs number is not the equivalent of a reliable index which measures the rate of change in labor inputs supplied to the US economy. It is essentially a statistical anecdote. It not only counts 10 hour per week “temp” gigs and real 50 hour jobs the same, but also ignores entirely the quality of hours worked as proxied by the hourly pay rate.
Sure, there may be some public policy purpose in getting a paycheck—however small—-to as many citizens as possible. But that’s a political objective. It can’t possibly be a valid metric for measuring the economic condition of the labor market—– let alone a justification for the massive distortions of the price of money and debt that result from the Yellen’s Fed’s effort to steer the financial system based on a dashboard riddled with BLS numbers noise, not solid economic signals.
Moreover, the real story is that the quality mix of payroll jobs is deteriorating far faster than even the tepid rate of gain in the headline jobs count. Even as to the latter, there is not much beneath what bubblevision has been reporting for lo these past 15 years.
In January 2000, the BLS posted 131 million payroll jobs. That number had first climbed to 138.3 million seven years ago before falling back during the Great Recession when the phony construction, retail, bar and restaurant and service jobs created during the housing boom were liquidated; and by October 2014 the headline number had crept marginally higher to 139.7 million.
Stated another way, even the headline jobs number has grown at only 0.3% annually since the turn of the century—a rate which amounts to only 49k jobs per month or about one-third of the growth rate of the working age population. And we are not speaking about a few months or a limited phase of the business cycle here. This 15 year period encompasses the better part of three business cycles; its the embedded trend on which the transient monthly deltas actually ride.
Indeed, since the turn of the century, the working age population has grown from 212 million to nearly 250 million, but out of that potential 38 million gain, there has been only an 8.7 million pick-up in the headline payroll count. And even that dismal 22% ratio is flattered by the fact that, as demonstrated below, a growing share of the headline print consists of low wage, part-time jobs, and many of them represent multiple paychecks to the same person.
Nevertheless, the main point is that the quality mix and value added per job has deteriorated sharply during this same period of tepid headline growth. At the heart of the economy is goods production—manufacturing, energy/mining and construction— because that’s were real productivity and wealth generation comes from, and its the source from which we pay for our massive $2.8 trillion annual import bill.
As shown below, jobs in the goods production sector have been in continuous free fall during this entire century; and even taking account of the macro-cycles there have been lower highs and lower lows for 15 years. Notwithstanding the “best year for job creation since 2005″, there were 5.4 million or 22% fewer goods producing jobs in October 2014 than there were the month Bill Clinton was packing his bags to leave the oval office.
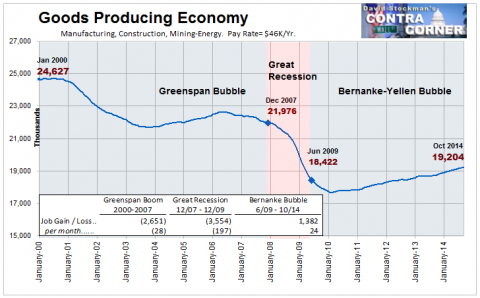
Goods Producing Economy
The conceit of the Keynesian money printers is that the modest rate of recovery since the 2009 bottom shown above—about 12,000 jobs per month—–will continue indefinitely. Apparently, even to the end of time because all of the official Keynesian macro-models, like those of the Fed and CBO, achieve “full employment” a few years down the road and remain there forever.
But Washington has not outlawed the business cycle, of course. And the world is pulsating with negative headwinds emanating from Japan, Europe and China, while the world’s central banks have now inflated the mother of all financial bubbles for the third time this century.
So given even two more years before the next recession—-which would extend this wobbly “recovery” cycle to 90 months or a near record—-would leave the goods producing sector with about 19.5 million jobs at the current expansion rate. In other words, despite 16 years of frenetic Keynesian money printing, the goods producing sector would end up 20% smaller than it was at the turn of the century.
Nor is this point some kind of nostalgia trip about the glories of manufacturing and mining in an allegedly post-industrial society. In fact, to get to what I have termed the “breadwinner” economy it is necessary to layer on top of the 19 million goods producing jobs reported by the BLS for October another 50 million jobs encompassing the other major full-time, full-pay categories contained in the establishment survey.
These include about 8 million jobs in finance, insurance and real estate (FIRE); 17 million jobs in the white collar mainstream such as lawyers, accountants, architects, computer designers, engineers and business managers and consultants; 8 million jobs in the transport, warehousing and distribution of goods, including processing and transferring the massive throughput of nearly $5 trillion in import-export trade; and another 17 million in core government jobs outside of education, as well as utilities, the postal service and the aforementioned category called information technology.
Altogether, these 69 million breadwinner jobs account for about half of the BLS total, but a far larger proportion of value added and wage and salary income owing to much higher hours per week and hourly compensation. Indeed, from an economic perspective “breadwinner” jobs comprise upwards of two-thirds of the labor market.
Yet here is the trend since the year 2000, and its the same story. By the lights of even the BLS’ rickety “establishment survey”, and after giving effect to all of its endless revisions, re-benchmarkings, imputations and phantom “birth and death” jobs, the number of breadwinner jobs at the core of the US economy is still 3.5 million or 5% lower than its was at its high water mark in early 2001.
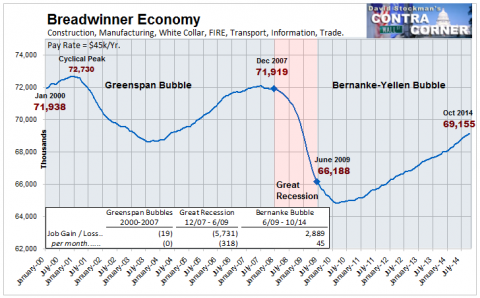
Breadwinner Economy
So now you have a real conundrum. The above chart encompasses the entirety of the productive core of the US labor market—including 11 million high paying jobs in local, state and Federal payrolls, excluding education. At the tepid rate of breadwinner job recovery since the June 2009 bottom, it would take until the year 2021 to reach the level of breadwinner jobs first obtained back in early 2001.
Needless to say, the odds that there will be smooth sailing in the world and domestic economies for the next seven years are slim to none. And, as shown in the two boom-and-bust cycles pictured above, the next recession—perhaps caused by the collapse of China’s debt-besotted house of cards or the old age bankruptcy of Japan, or the fiscal collapse of Europe or the next global financial meltdown—-will cause another sharp loss of breadwinner jobs during the correction phase. Then, under the best of conditions, there would be another long period of “recovery” in which “born again” breadwinner jobs would be brought back onto payrolls as they were between 2002-2007 and 2009-2014.
Even that optimistic scenario, however, assumes that the massive fiscal hemorrhage which will occur during the 2020s due to the full retirement of the baby boom generation will somehow be navigated successfully. In short, the odds that the American economy will ever again achieve the level of breadwinner jobs that it had at the turn of the 21st century are pretty remote—-at least as far as the eye can see today.
By contrast, it is probable that the other half of the economy will continue to generate at least some gains in the headline jobs number. But what this means is that the mix will continue to deteriorate, and that the headline number will become an increasingly misleading index with respect to the actual labor market.
Already, this distortion is quite massive. Whereas the US economy has lost about 3.5 million breadwinner jobs since the year 2000, it has gained 4 million part time jobs. On an hours and pay weighted basis, however, these latter “jobs” account for only about 40% of the income value of each breadwinner job lost.
So the jobs mix has been deteriorating steadily for a decade and one-half. Accordingly, on a mix-adjusted basis, the index value of the establishment survey jobs count is actually heading south on a long-term basis.
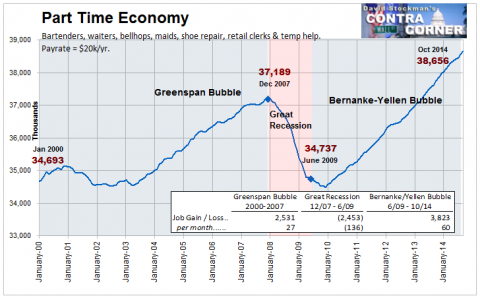
Part Time Economy
The balance of the payroll report consists of about 32 million jobs in the HES-Complex (health education and social service). As I have previously noted, these jobs have one-third less income value than breadwinner jobs, but suffer from the even greater disability. Namely, that they are “fiscally dependent” and the public sector in the US is essentially broke.
Already, the mild fiscal crisis to date has caused the rate of monthly expansion to drop from 51k prior to 2007, to only 28k during the period since July 2009. When the real fiscal crunch comes after 2020, it is virtually certain that whatever jerry-built cost control system is in place—whether Obamacare or any conceivable modification or replacement—-will grind the rate of health spending growth to a near halt, and with it the long interlude of job gains which have flattered the headline reports for several decades.
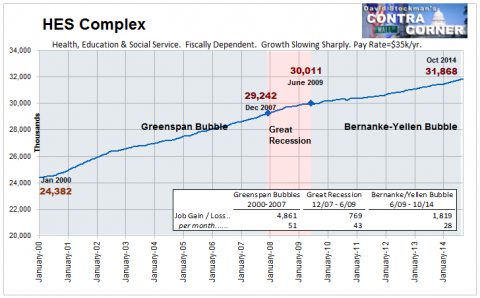
HES Complex
Stated differently, there has been no net gain in headline jobs since the turn of the century outside of the HES Complex. Yet that growth was driven by an unsustainable uptake in the share of GDP consumed by health care (and to a lesser extent education). But as the economic humorist, Herb Stein, once noted—anything which is unsustainable tends to stop.
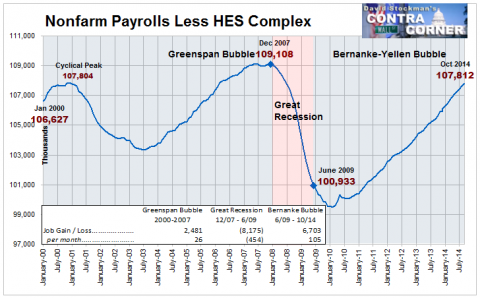
Nonfarm Less HES Economy
At the end of the day, it is overwhelming clear that the headline jobs number is thoroughly and dangerously misleading because there has been a systematic and relentless deterioration in the quality and value added of the jobs mix beneath the headline. It has no value whatsoever as an index of labor market conditions, labor market slack or even implied GDP growth.
To be sure, there is an easy alternative to the establishment survey headline number. Namely, the hours index shown at the beginning of this post.
But that would never pass muster in the Eccles Building. It would show that a 9X increase in the Fed’s balance sheet during this century has not generated a single net labor hour in the nonfarm business economy.
Moreover, it might even raise another issue. Why in the world should the value of money and the price of securities in the capital markets be driven by the quantity of labor consumed by the US economy—however measured?
The truth is, in an open global economy the quantity of labor utilized by the US economy is a function of its price—not the level of interest rates or the S&P 500. Currently, wage rates on the margin are too high, but the Fed’s ZIRP and money printing campaigns only compound the problem.
They permit the government to fund with ultra low-cost bonds and notes a massive transfer payment system that keeps potential productive labor out of the economy, and thereby props up bloated wages rates; and it enables households to carry more debt than would be feasible with honest interest rates and competitively priced wage rates, thereby further inhibiting the labor market adjustments that would be required to actually achieve full employment and sustainable growth.
Furthermore, ZIRP sharply distorts the business choice between the carry cost of debt and the carry cost of labor on the margin. In today’s Fed underwritten casino, corporate managements are rewarded for using cash flow and cheap borrowings to fund stock buybacks and dividends and to finance “restructuring costs” associated with job terminations.
At the end of the day, what the American economy actually requires is a deflation of its uncompetitive cost levels and labor rates. Ironically, the sum and substance of the policies being pursued by paint-by-the-numbers money printers at the Fed and other central banks is to thwart the ability that businesses and workers operating in an honest free market would otherwise have to achieve exactly that.
more


