
This Week’s Top Market Movers, Lessons: Data Versus Ukraine
How bullish and bearish forces align for stock indexes, forex and other global markets, both technical and fundamental outlooks, likely top market movers.
Summary
–Technical Outlook: European indexes diverging from US and Asia, but no material signs of market reversal, only correction
–Fundamental Outlook, Market Movers: Ukraine events most dominant, followed by EU data as ECB likely to move alter policy before the Fed or other leading central banks
–Fundamental Outlook, Lessons: Data gap between US and Europe, fundamental challenges for each region
The following is a partial summary of the conclusions from the fxempire.com weekly analysts’ meeting in which we cover outlooks for the major pairs for the coming week and beyond.
Technical Picture: Europe Continues To Diverge From US And Asia
We look at the technical picture first for a number of reasons, including:
Chart Don’t Lie: Dramatic headlines and dominant news themes don’t necessarily move markets. Price action is critical for understanding what events and developments are and are not actually driving markets. There’s nothing like flat or trendless price action to tell you to discount seemingly dramatic headlines – or to get you thinking about why a given risk is not being priced in
Charts Also Move Markets: Support, resistance, and momentum indicators also move markets, especially in the absence of surprises from top tier news and economic reports. For example, the stronger a given support or resistance level, the more likely a trend is to pause at that point. Similarly, a confirmed break above key resistance makes traders much more receptive to positive news that provides an excuse to trade in that direction.
Overall Risk Appetite Medium Term Per Weekly Charts Of Leading Global Stock Indexes
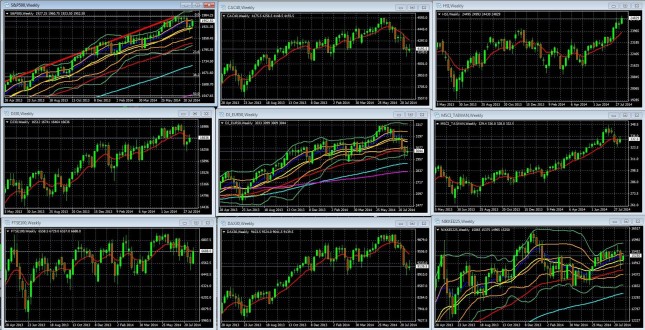
Weekly Charts Of Large Cap Global Indexes With 10 Week/200 Day EMA In Red: LEFT COLUMN TOP TO BOTTOM: S&P 500, DJ 30, FTSE 100, MIDDLE: CAC 40, DJ EUR 50, DAX 30, RIGHT: HANG SENG, MSCI TAIWAN, NIKKEI 225
Key For S&P 500, DJ EUR 50, Nikkei 225 Weekly Chart: 10 Week EMA Dark Blue, 20 WEEK EMA Yellow, 50 WEEK EMA Red, 100 WEEK EMA Light Blue, 200 WEEK EMA Violet, DOUBLE BOLLINGER BANDS: Normal 2 Standard Deviations Green, 1 Standard Deviation Orange.
Source: MetaQuotes Software Corp, www.fxempire.com, www.thesensibleguidetoforex.com
02 Aug. 17 12.01
Key Points
US and Asian stocks remain in their medium term and long term uptrend, although their dip into the upper half of theirdouble Bollinger® band neutral zones suggests a neutral outlook in the weeks ahead.
In contrast, European stocks are in at minimum a medium term downtrend, and they remain stuck in their double Bollinger® band sell zones, suggesting more downside ahead. Indeed, despite this week’s modest gains for our sample European indexes, they’ve logged another weak of lower highs and lower lows, and also closed in the lower end of the week’s trading range.
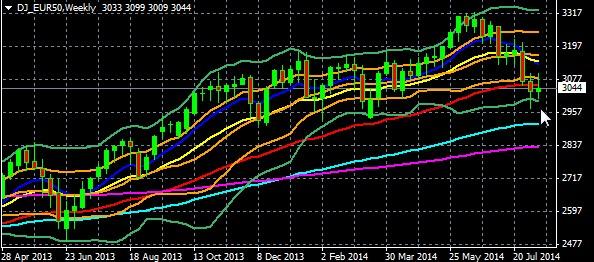
Weekly DJ Eurostoxx50 Index, April 28 2013 To Present
Key: 10 Week EMA Dark Blue, 20 WEEK EMA Yellow, 50 WEEK EMA Red, 100 WEEK EMA Light Blue, 200 WEEK EMA Violet, DOUBLE BOLLINGER BANDS: Normal 2 Standard Deviations Green, 1 Standard Deviation Orange.
Source: MetaQuotes Software Corp, www.fxempire.com, www.thesensibleguidetoforex.com
06 Aug. 17 17.11
That said, note for perspective that even Europe remains in a long term uptrend since mid-2012, as illustrated below with the weekly DJ Eurostoxx50 index.
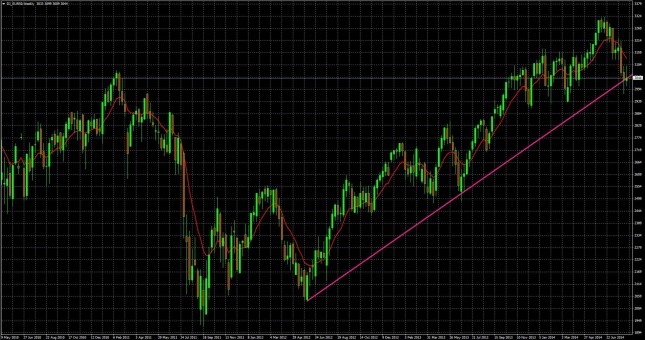
Weekly DJ Eurostoxx50 Index, May 2010 To Present
Key: 10 Week EMA Dark Blue, 20 WEEK EMA Yellow, 50 WEEK EMA Red, 100 WEEK EMA Light Blue, 200 WEEK EMA Violet, DOUBLE BOLLINGER BANDS: Normal 2 Standard Deviations Green, 1 Standard Deviation Orange.
Source: MetaQuotes Software Corp, www.fxempire.com, www.thesensibleguidetoforex.com
05 Aug. 17 17.07
In sum, even in Europe, the technical picture is one of a bull market correction rather than the start of a longer term bear market.
Fundamental Picture 1: Likely Market Movers To Watch
As always, we evaluate potential market movers by their potential to influence the two things driving most global markets since the start of the sustained recovery in risk assets that began in mid- 2012.
-The belief in continued supportive central bank policy that keeps rates low and supports risk asset prices. In other words, all data is viewed from the perspective of whether or not it alters expectations for central bank policy. It hasn’t, so the weekly economic calendar events haven’t been influential on price action.
-The absence of any perceived threat to global markets since ECB President Draghi convinced markets that the ECB could and would prevent further contagion threats from the EU. The flaws in the EZ have not been fixed, so we can only say that the while the crisis is far from over, it remains in hibernation.
If you keep the above two market drivers in mind, the trends in recent years make sense. Last week’s price action is illustrative. For example:
– Last week’s US and EU data last week was poor, but it didn’t prevent a modest bounce last week in our sample leading global indexes shown above. Economic reports continue to paint the same picture, modest growth in the US and Asia, and stagnation or recession in Europe.
–In contrast, fears of economic damage from escalating fighting and economic sanctions has noticeably moved global indexes and other risk assets in recent weeks.
In sum, with economic data failing to provide any surprises big enough to alter perceptions about major central bank behavior, like the pace and rate of Fed tightening or ECB easing, the market has been moving more with Ukraine-related events than anything else. Europe is far more exposed to this crisis than the Americas or Asia, so it’s not surprising that European indexes have performed noticeably worse in recent months. That said, note that neither the pace or extent of even European index declines suggest any deep concern.
So with the above in mind, what events next week have the potential to move global markets?
Ukraine Crisis Escalation Would Dominate Markets
Two weeks ago global stocks reversed their short term downtrend on the belief that Russia was pulling back from further aggression. The past week’s modest rally was stopped by news that Russia was openly sending both men and equipment. On Saturday both Reuters and FT.com reported that Russian separatist forces are receiving an influx of soldiers and equipment, including armored troop carriers and tanks.
These confirm earlier reports from Ukraine that its forces had engaged Russian armored forces.
If in fact Russia is openly stepping up increased support for the separatists, that fact alone will dominate markets and undermine the influence of scheduled calendar events.
If Ukraine Calms, EU Data Could Dominate
Given current growth trends, it’s much more likely that the ECB eases before the Fed tightens.
For example, the past two weeks have shown that the EU’s top two economies, France and Germany, have stopped growing, (Germany actually contracted), so there’s real weakness in the very core economies. Meanwhile, 2 weeks ago #3 Italy printed its second straight negative GDP figure and is now officially in recession yet again, and deflation remains a threat.
Thus EU data has more potential to move global markets because it is more likely to change ECB policy. Certainly this seems to be what bond markets are thinking, as they suggest growing odds of some kind of new ECB easing. For example, German bond yields have continued to fall. We don’t think that’s purely a flight to safety move, as bond yields have been falling for far less credit worthy nations, like Belgium, Italy, and Spain.
Indeed, note how Spanish yields have been falling at about the same pace as Germany’s.
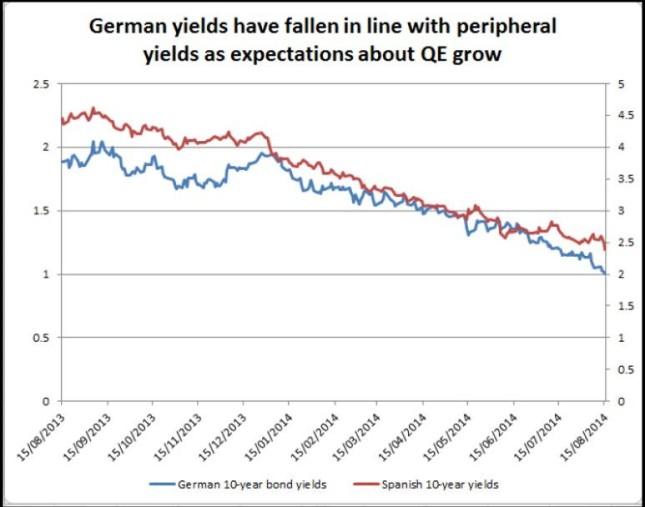
Source: forex.com
03 Aug. 16 23.13
The EU events with the most potential to fuel higher expectations for further ECB action are:
- Thursday’s batch of manufacturing and services PMI reports
- Friday’s speech by ECB President Draghi, though this comes late in the day after European markets have mostly closed, so the impact of any surprises might not be felt until the following week.
Other Top Economic Calendar Events To Watch
Monday: Nothing
Tuesday
US: Building permits, CPI, housing starts
Wednesday
US: FOMC meeting minutes
Thursday
China: HSBC flash mfg PMI
EU: French, German, EU flash mfg and services PMIs
US: Weekly new jobless claims, existing home sales, Philly fed mfg index
All: Day 1 of 3 of Jackson hold symposium (has been a venue for major Fed announcements, none anticipated, however.
Friday
US: Fed Chair Yellen Speaks
EU; ECB President Draghi Speaks
All Day 2 of 3 of Jackson Hole symposium
Saturday
All Day 3 of 3 of Jackson Hole symposium
Fundamental Picture 2: Lessons For The Coming Week And Beyond
Divergence Between US, European Growth Reflected In Markets
The divergence in trends between US and European markets ultimately continue to reflect the regional difference in growth and earnings.
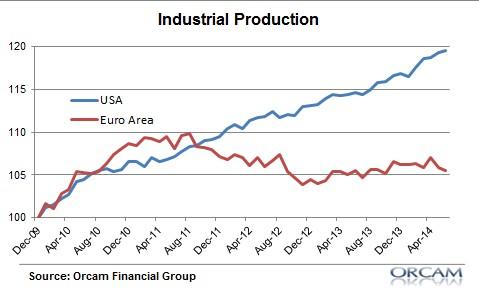
Source: Pragcap.com
07 Aug. 17 18.48
EU’s Stark Choice Remains: Integrate or Disintegrate
This is hardly a brilliant insight, but worth remembering. Why the divergence? We’ve said for years that the EU is going nowhere as long as it is burdened by a dysfunctional currency union that is doing the EZ far more harm than good. Cullen Roche of paragcap.com weighed in with a summary of his similar position this week in his post Three Reasons Europe is Struggling.
Data Gap Between US And Europe Persists
Meanwhile the US continues its slow and rather uneven recovery.
Additional positives (via Jeff Miller here) from US data last week include:
- Earnings season showed overall earnings growth of 9.6% y/y. (Ed Yardeni). Worth noting is that despite positive overall earnings for Q2 2014, the average % price change that day was -0.7%
- Tax revenues are up (via Scott Grannis , Taxes Don’t Lie.)
The big negatives for the US last were:
- Retail sales badly missed forecasts, a problems given that consumer spending accounts for 70% of GDP.
- Mortgage applications continue to fall despite continued low rates
Stagnant Wage Growth Dooms US To Slow Growth?
As Europe’s fundamental economic challenge is its flawed currency union, America’s is lack of income growth. The story is not new, but there were some excellent articles out last week on this.
Doug Short’s Five Decades of Middle Class Wages details how US incomes have fared over the past decades (before taxes) once we factor in inflation and declining hours per week. This chart sums it up.
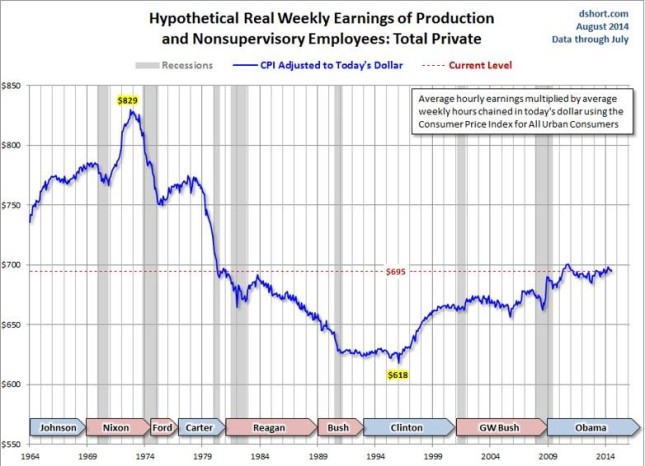
01 Aug. 18 10.48
If about 70% of US GDP is based on consumer spending, and consumer incomes have been flat for over a decade, and have declined since the 70s, what does that tell us about future growth and prosperity. Granted, the overall economy can grow even if household incomes are falling, as long as there is enough population growth. For (a simple) example, a thousand people earning and spending $100 should produce the same GDP as 100 people earning and spending $1000.
For additional details see:
Eric Mcwhinnie’s 5 Signs Americans Are Flat-Out Broke , which includes:
Weak Job Market Means Falling Returns On Higher Education
The University of Arizona released an update earlier this year on its study of a freshmen cohort group — dating back to 2007. More than half the participants — mostly graduates — reported relying on financial support from family to meet current financial demands. Nearly half of those respondents were employed full-time. In fact, as the chart above shows, only 49 percent of participants reported having full-time jobs after two years of graduation.
Rising Car Prices And Falling Incomes Bring Longer Term Car Loans
Per Experian Automotive, the average auto loan term hit a new record of sixty-six months during the first-quarter. The average loan for a new vehicle of $27,612 was also a record high.
Falling Home Ownership Rates Despite Record Low Mortgage Rates
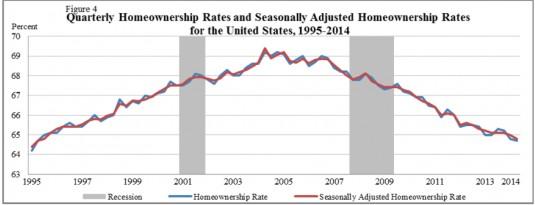
Source: US Census Bureau
02 Aug. 18 11.10
Savings
Per Bankrate.com, 67% of Americans don’t have enough savings to cover 6 months of expenses, and 50% don’t have enough savings to cover 3 months of expenses. Even households with $75,000 or more in annual incomes, only about 46% have enough savings to cover six months of expenses.
Falling Household Wealth
Net worth at the 50th percentile (median) totaled $56,335 in 2013, down 36 percent from $87,992 in 2003, according to a recent report from the Russell Sage Foundation
The above is for informational purposes only, responsibility for all trading or investing decisions lies solely with the reader.


