
Time For Bulls To Be Skeptical – Weekly Market Outlook
After five weeks of bullishness that took stocks to record highs, it didn't come as a complete surprise to see the market take a modest tumble last week. All told, the S&P 500 (SPX) (SPY) slipped 1.9% over the course of last week, breaking back under a key line in the sand at 1850.
Is this the long-awaited beginning of the end of the end of the bull market, or is it just another of many small setbacks within a major uptrend… or is it something in-between? The odds are, this is something in-between, meaning we haven't likely hit bottom yet, but we're not expecting any major meltdown from here.
We can show you exactly what's leading us to that expectation with our charts below, but first, let's review last week's and this week's major economic numbers.
Economic Calendar
While the economic calendar was pretty full last week, truth be told, not much of last week's data was all that important. The only items of any real interest were February's retail sales and producer inflation.
As for consumer spending, retailers took in 0.3% more last month, with or without automobiles. It's an encouraging turnaround from January's 0.3% slide in retail sales (-0.6% with cars being factored in). Of course, January's miserable weather was likely the bulk of the reason January's consumer spending slumped.
As for producer price inflation, one can't help but wonder if we're seeing flashes of deflation now. Though prices haven't been falling (on an annualized basis) since late-2009, for February, the producer price inflation index tumbled 0.1% (-0.2% on a core basis). The annualized PPI rate is still a positive 0.9%, and the annualized consumer inflation rate stands at 1.58% as of January. But, broadly speaking, pricing power has been waning for a while, pulling back from levels that were never particularly strong to begin with.
Inflation Trends Chart
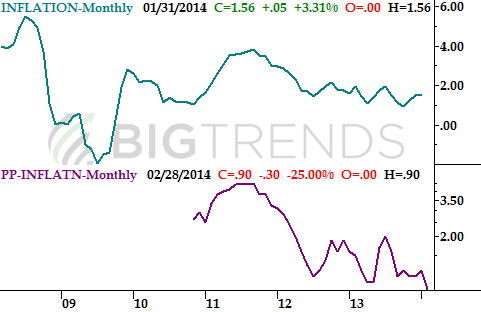
Sources: U.S. Bureau of Labor Statistics, InflationData.com
Economic Calendar
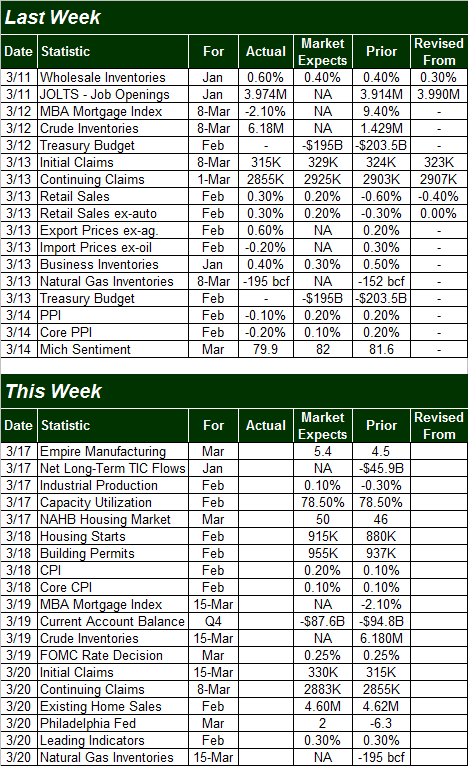
Source: Briefing.com
As you saw, this week is going to be a little busier, but it will be loaded with important data… particularly on the real estate and construction front. The first heavy-duty data won't have anything to do with housing, however. It will be Monday's industrial production and capacity utilization number for last month. While neither have been in a freefall of late, neither have been as strong as we'd need to see in order to say the economy was self-sustaining. The numbers for February aren't expected to be significantly better than January's levels, and if for some reason we happen to fall short of the already-low expectations, it could be a problem.
As for the housing market, Wednesday's starts and permits numbers and Thursday's existing home sales figure from the NAR make up a big dose of February's real estate picture. Housing starts and building permits are both expected to be up a little for last month, while existing home sales will be essentially flat.
Real Estate/Construction Trends Chart
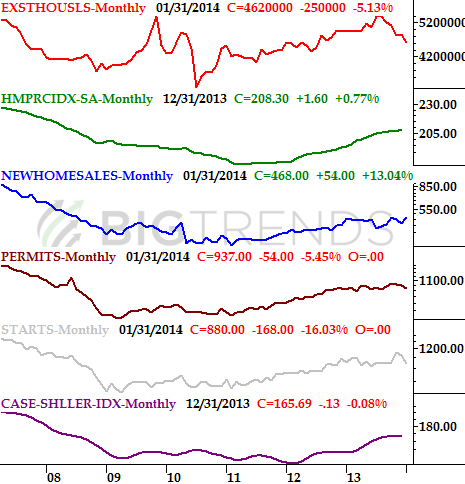
Sources: Realtor.org, U.S. Census Bureau, Standard & Poor's, and FHFA
Overall, while real estate isn't an economic liability per se, it's not as firm as we'd like it to be. The same underpinnings that are crimping inflation are crimping the housing and construction market.
Stock Market Index Analysis
Just to put things in the right perspective first, this week we're going to start with the bigger-picture weekly chart of the S&P 500. It's only in this timeframe that we can make two key points: (1) The market isn't likely at its ultimate near-term bottom, but (2) hitting the bottom isn't going to be something earth-shattering.
With that in mind, even with just a quick visual inspection of the S&P 500's weekly chart, last week's lull actually makes a lot of sense. The market have us a good five-week, 6.0% rally, and if the long-standing pattern repeats itself, the index should revisit the 1800 area, give or take.
S&P 500 & VIX – Weekly Chart
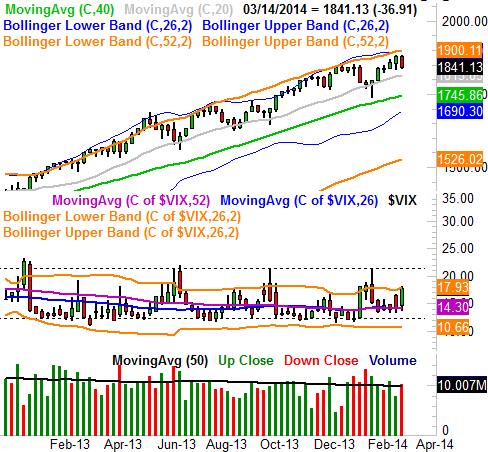
All charts created using Omega Research TradeStation 2000i.
The bottom for the market, however, may have less to do with exactly where the S&P 500 is going to find a technically floor and have more to do with when the CBOE Volatility Index (VIX) (VXX) hits a key ceiling… a ceiling that's been proven to be around 21.40 (dashed) three times since June of last year. We may not hit that mini-capitulation we really need until the VIX gets back near that level.
Nothing really changes when you zoom into the daily chart of the S&P 500, though we do get some more detail in the budding pullback. It looks about what it you'd expect… a gradually-developed (and relatively decisive) rollover. And, now that the index is under its 20-day moving average line at 1854.2, it's tougher to argue that the bigger short-term trend is still bullish.
S&P 500 & VIX – Daily Chart
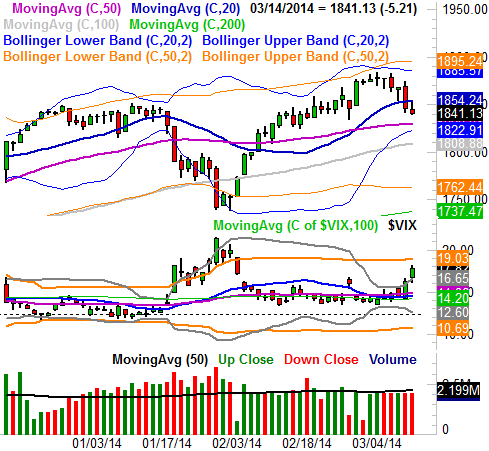
That being said, there's a whole swath of potential support levels such as 1809 and 1828, any of which could provide some bullish pushback. Don't get suckered into thinking that's the beginning of a bounce back into the bigger uptrend. Only a cross back above the 20-day moving average line will confirm we're back in a bullish mode. Any bullish clues we see develop between 1809 and 1828 should be viewed with skepticism. As we mentioned above, 1800 makes a little more sense as a floor. Our expectation now is a dip that looks a lot like the one we saw in January.
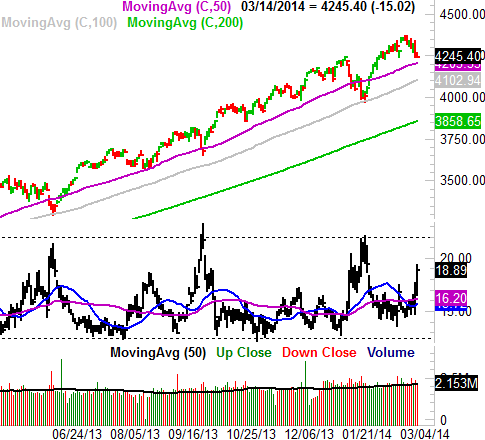
And just for the record, it's not like the S&P 500 is unique in its "short-term weakness, long-term strength" scenario. The NASDAQ Composite (COMP) (QQQ) is telling the same story, with a little more consistency. The NASDAQ's 100-day moving average line (gray) has been the floor for two of the last three pullbacks, and the last three major dips have only stopped when the (VXN) – the NASDAQ Composite's Volatility Index – hit resistance around 22.0 (dashed).
NASDAQ Composite & VXN Daily Chart
Yes, anything can happen, so it's not like anyone would want to make blind bearish bets here. From an odds-making perspective though, one has to think the high-odds play from here is a little more bearishness. Until/unless the S&P 500 gets back above the 20-day moving average line, the undertow remains bearish.
Trade Well,
Price Headley
None.


