
US Economic Profile
The latest economic releases look wobbly in some corners–yesterday’s report on housing starts, for example. But the monthly comparisons for several indicators, although weak, appear to be noise at this time in terms of evaluating the business cycle. Indeed, reviewing macro conditions across a broad set of figures still points to growth. True, the outlook for expecting an acceleration in economic activity has fallen on hard times again. But the moderate expansion that’s prevailed lately will likely roll on, based on the August update of a diversified set of 14 economic and financial indicators.
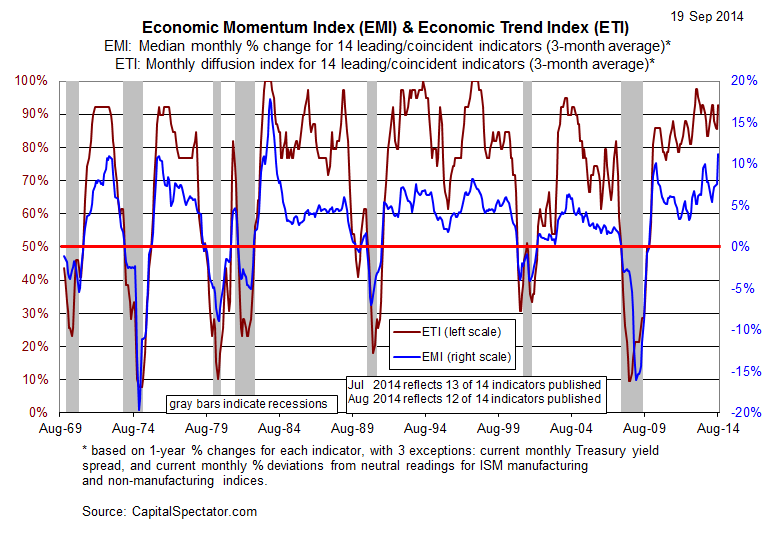
Using a methodology outlined in Nowcasting The Business Cycle: A Practical Guide For Spotting Business Cycle Peaks, a broad review of economic and financial trends suggests that recession risk remains low at the moment. The Economic Trend and Momentum indices (ETI and EMI, respectively) remain at levels that equate with expansion.
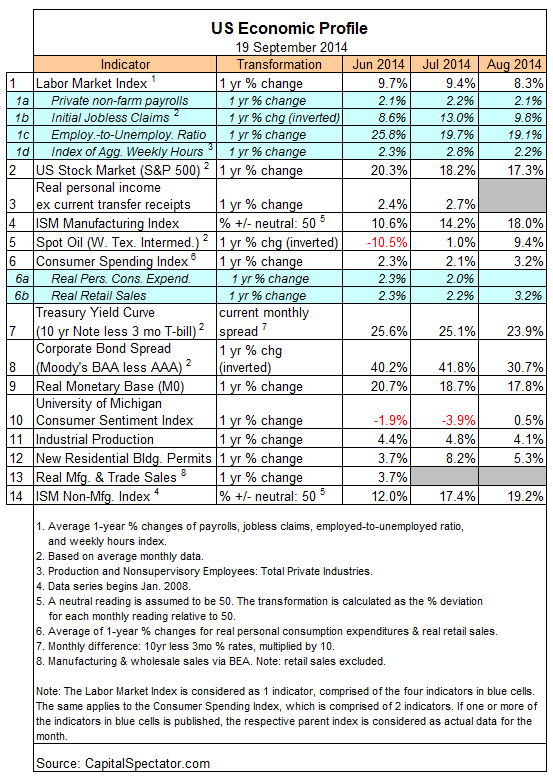
Using the latest set of numbers for August reflects positive trends across the board. In the previous update for July, the lone weak spot was consumer sentiment. But in the August release, the Reuter’s/University of Michigan’s Consumer Sentiment Index inched higher and shifted to a positive year-over-year reading for the first time since April. As a result, the current August lineup of published indicators so far (12 of 14 data sets) for ETI and EMI show positive trends in all cases. That doesn’t preclude weak-to-moderate growth in the nation’s output, but the overall bias for expansion still looks compelling at this stage.
For deeper perspective, let’s turn to the numbers, starting with a summary of ETI and EMI’s individual components:
Aggregating the data into business cycle indexes continues to look encouraging. Reviewing the latest numbers for ETI and EMI shows that both benchmarks are well above their respective danger zones: 50% for ETI and 0% for EMI. When the indexes fall below those tipping points, we’ll have clear warning signs that recession risk is elevated. For now, however, there’s still a comfortable margin of safety between current values for August (92.7% for ETI and 11.3% for EMI) and the danger zones.
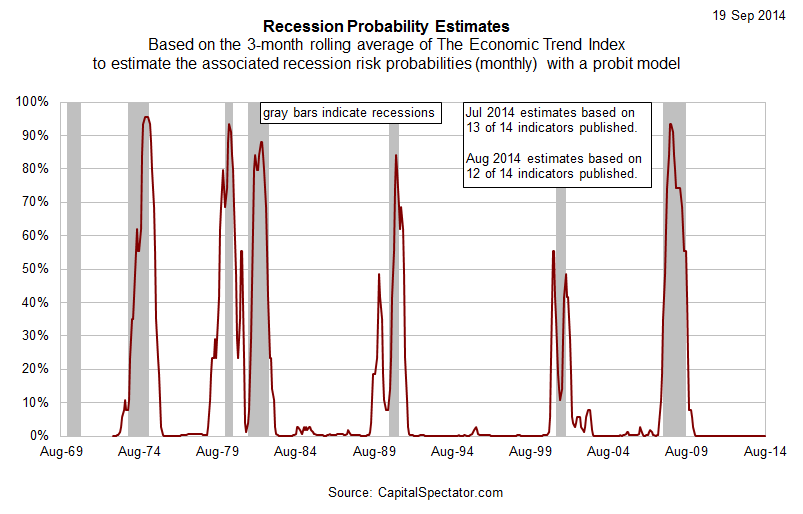
Translating ETI’s historical values into recession-risk probabilities via a probit model also suggests that business cycle risk remains low. To be precise, the data implies that the odds are virtually nil that the National Bureau of Economic Research (NBER)–the official arbiter of business cycle dates—will declare last month as the start of a new recession.
Next, let’s consider how ETI’s values may evolve as new data is published in the near future. One way to estimate expected values for this index is with an econometric technique known as an autoregressive integrated moving average(ARIMA) model, based on calculations via the “forecast” package for R, a statistical software environment. The ARIMA model calculates the missing data points for each indicator, for each month through October 2014. (June 2014 is currently the latest month with a complete set of published data). Based on today’s projections, ETI is expected to remain well above its danger zone in the near term.
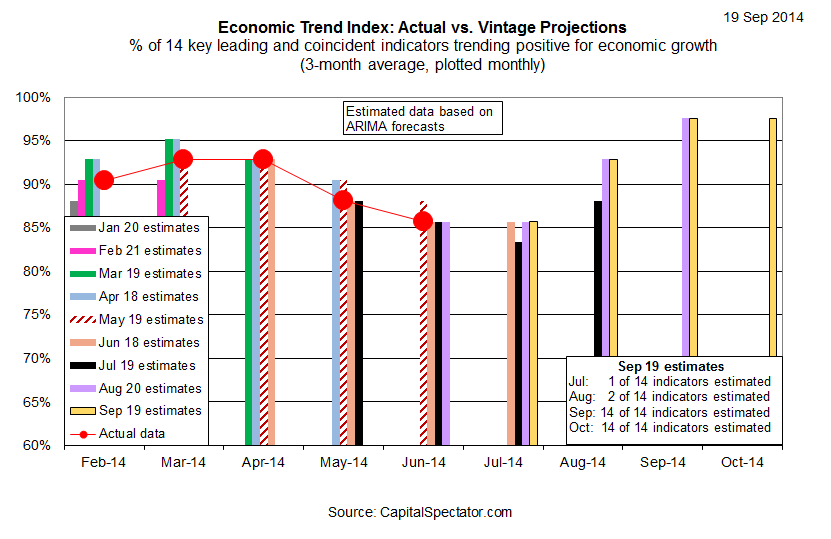
Forecasts are always suspect, of course, but recent projections of ETI for the near-term future term have proven to be relatively reliable guesstimates vs. the full set of published numbers that followed. That’s not surprising, given the broadly diversified nature of ETI. Predicting individual components, by contrast, is prone to far more uncertainty in the short run. As such, the latest projections (the four yellow bars on the right in the chart above) offer support for cautious optimism. The chart above also includes the vintage ETI projections published on these pages in previous months, which you can compare with the complete monthly sets of actual data that followed, based on current numbers (red circles). The assumption here is that while any one forecast for a given indicator is likely to be wrong, the errors may cancel one another out to some degree by aggregating a broad set of predictions. The historical record for this forecast methodology suggests that’s a reasonable assumption for peeking into the near-term future.
For additional perspective on judging the value of the forecasts based on the historical record, here are the previous updates for the last three months:
Disclosure: None.


