
US Retail Sales: October 2014 Preview
US retail sales are expected to rise 0.3% in tomorrow’s October report vs. the previous month, according to The Capital Spectator’s median econometric forecast. The prediction reflects a substantial rebound in growth vs. the previous month’s 0.3% decrease.
Compared with a trio of estimates based on recent surveys of economists, The Capital Spectator’s median projection for October is at the upper range of the consensus forecasts.
Here’s a closer look at the numbers, followed by brief summaries of the methodologies behind the forecasts that are used to calculate The Capital Spectator’s median prediction:
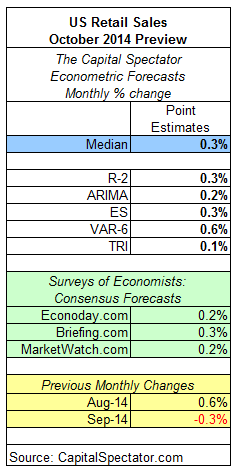
R-2: A linear regression model that analyzes two data series in context with retail sales: an index of weekly hours worked for production/nonsupervisory employees in private industries and the stock market (Wilshire 5000). The historical relationship between the variables is applied to the more recently updated data to project retail sales. The computations are run in R.
ARIMA: An autoregressive integrated moving average model that analyzes the historical record of retail sales in R via the “forecast” package.
ES: An exponential smoothing model that analyzes the historical record of retail sales in R via the “forecast” package.
VAR-6: A vector autoregression model that analyzes six time series in context with retail sales. The six additional series: US private payrolls, industrial production, index of weekly hours worked for production/nonsupervisory employees in private industries, the stock market (Wilshire 5000), disposable personal income, and personal consumption expenditures. The forecasts are calculated in R with the “vars” package.
TRI: A model that’s based on combining point forecasts, along with the upper and lower prediction intervals (at the 95% confidence level), via a technique known as triangular distributions. The basic procedure: 1) run a Monte Carlo simulation on the combined forecasts and generate 1 million data points on each forecast series to estimate a triangular distribution; 2) take random samples from each of the simulated data sets and use the expected value with the highest frequency as the prediction. The forecast combinations are drawn from the following projections: Econoday.com’s consensus forecast data and the predictions generated by the models above. The forecasts are run in R with the “triangle” package.
Disclosure: None.


