
Valuations Continue Higher Amid A Very Low VIX – Weekly Market Outlook
It's easy to forget just how unpredictable and how emotional the market can be at times. Last week was a reminder of that reality. Once we got the slightest of nudges a couple of weeks ago, bored/impatient investors started seeing every glass as half full rather than half empty. Right or wrong, sometimes that's all it takes. The problem with those knee-jerk, impulse moves is, they rarely last. And, considering that we've yet to see any real volume behind the rally to date, the lack of interest and participation in it suggests the tank may be at or near empty.
We'll take a look at the details in a moment. The first thing we need to get out of the way is painting the bigger economic picture.
Economic Calendar
While the calendar of economic news may have been chock full last week, truth be told, there was only one data set of any real importance… last month's employment numbers. They weren't great, but they were good.
We should have had an inkling Friday's official numbers from the Department of Labor were going to be at least decent as early as Wednesday. That's when the ADP Employment Change figure of 179,000 new payrolls for May was posted. That's shy of the expected 200,000 and weaker than April's 215,000. It's still a solid number though.
And what did the DOL have to say on the matter of employment when it published its May report on Friday? It said 217,000 new jobs were created last month. That's a drop from April's big 282,000 new payrolls, but it was still above the critical 200,000 mark… the fourth month in a row we've seen more than 200,000 new jobs created. We haven't seen that long of a growth streak since 1999.
Employment Data Trends Chart
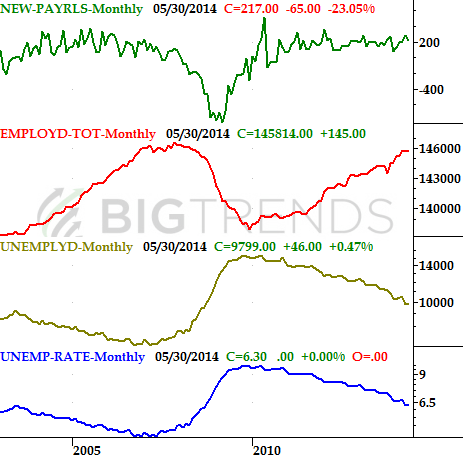
Source: Department of Labor
So what's not great about that? Well, for starters, the unemployment rate didn't budge – it remained at 6.3%. How'd that happen with so many new jobs being created? Because the size of the labor pool expanded by about the same size as the number of newly-created jobs, so there are actually just as many people out of work now (but want jobs) now as there were a month ago… a few more, technically. That's why the overall unemployment rate didn't move.
While it wasn't a bad report, we really need to add at least 300,000 jobs per month to really move the unemployment dial in a meaningful way.
Economic Calendar
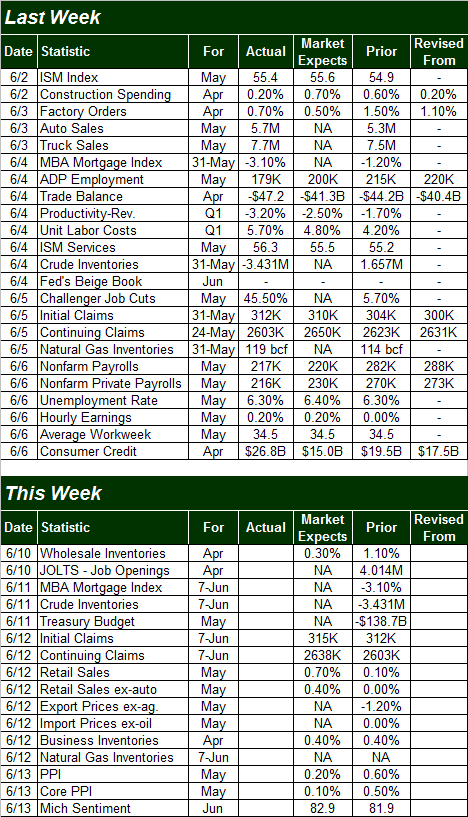
Source: Briefing.com
The coming week won't be quite as busy, and even most of the information shouldn't be market-moving. The biggies are Thursday's retail sales figures for May and Friday's producer price inflation data. Retail sales are a barometer of consumer health, of course, while the producer price inflation is a precursor of the consumer inflation data that will be unveiled next week.
You may recall we saw the PPI and CPI measures both surge considerably higher last month. The annualized consumer inflation rate now stands at 1.95%, while the annualized producer inflation rate is 2.1%. Those are still tolerable levels. The worry, however, is the sudden upturn both inflation data sets both took last month. If "up" is the new norm, we could quickly reach debilitating inflation levels very soon. Needless to say, the market will be watching Friday's PPI data and next week's CPI figures very closely, and could respond strongly to either number.
Inflation Chart
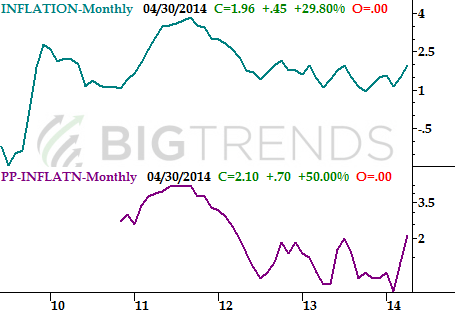
Source: Bureau of Labor Statistics
Stock Market Index Analysis
While the market may not have scored any points last week for reasonable, sustainable pacing, the breakout is undeniable. The question is, what's next? June is probably one of the worst months to expect a strong follow-through in the shadow of an uninterrupted (since May 21st) 4.1% gain. Yet, this breakout effort seems to have captured the hearts and minds of the bulls more so than any of the other recent bullish efforts. Maybe this is the real deal… the beginning of a rare summertime rally.
Let's first look at the more promising of the indices – the NASDAQ Composite (COMP). Two weeks ago it punched through the ceiling at 4155, though it was still vulnerable to a pullback at that point. As of last week though, the composite has put some distance between itself and the 4155 mark. Even if the NASDAQ slides a little lower, it's likely to remain above 4155, and therefore remain in a technical uptrend. Perhaps more important (and this is going to really matter in a moment), the composite still has some room to keep rising before hitting a headwind of prior highs.
NASDAQ Composite & VXN – Daily Chart
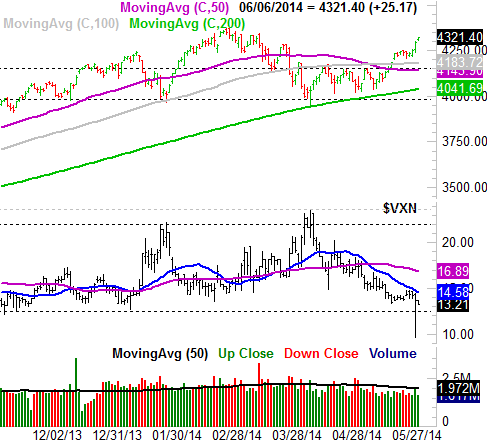
All charts created with TradeStation.
The S&P 500's (SPX) (SPY) daily chart tells the same basic story, but in a different way. Specifically, the S&P 500 also broke through a big technical ceiling of its own at 1900 a couple of weeks ago and has continued to roll higher since then. But, it's been blazing a trail into new-high territory the whole time and is overbought as a result… very overbought.
S&P 500 & VIX – Daily Chart
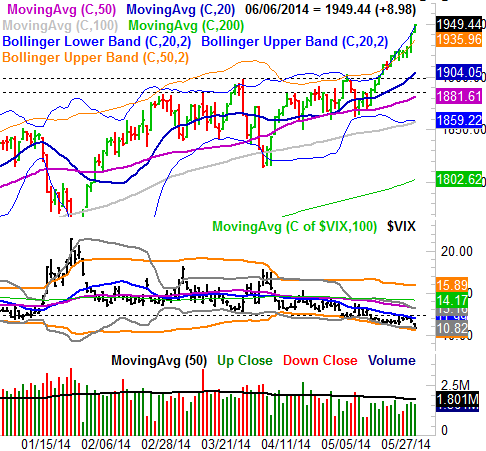
From a momentum standpoint, the bulls are clearly in charge. From a being-realistic standpoint, however, the bulls are asking the market to do something here that it hasn't been able to do in weeks, and hasn't been able to do very well in over a year. That is, the bulls are hoping the market will keep running past its current 4.1% gain when the biggest uninterrupted gain we've seen in the past twelve months has been no more than 8.1%.
Sure, one could argue that we're only halfway to what's the highest potential level, given the S&P 500's recent history. There's a difference between the market now and the market then, however. As of right now, the S&P 500 is trading at a trailing P/E of 17.4. That's as high as it's been in a 'normal' environment in years, [It was higher than that in part of 2008 and 2009, but only because the S&P 500 was posting net losses around that time and the math spiked the trailing P/E calculation.] The forward-looking P/E of 15.65 is a little more palatable, but the expectation for an 11% improvement in earnings over the next four quarters may be a little lofty.
Bottom line: Between an overbought market and a CBOE Volatility Index (VIX) (VXX) and a Nasdaq Volatility Index (VXN) that are at or near multi-year lows, it would be unwise not to plan for at least some sort of pullback soon. While it's possible the bulls might squeeze out the last of the market's potential momentum early on this week, it shouldn't take much longer for investors to realize how overextended we are now. The question is, to what extent are we vulnerable? The good news (for the bulls) is, there's a lot of technical support nearby. For the S&P 500 the 1900 could – and should – be a floor. For the NASDAQ, the floor's back at 4155. This is still a day-to-day and a one-week-at-a-time situation though, so we'll be reassessing this same time a week from now.
Trade Well,
Price Headley
None.


