
Weekly ADR Report
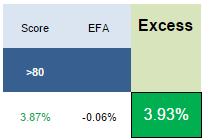
The average return of our best scoring ADRs from 1-year ago (11/25/2013) returned 3.87% in the past year, with no turnover. That generated 393 bps of excess to the MSCI EAFE index. The best performers from our list last year include SIG up 62%, SHPG up 53%, and SNN up 34%.
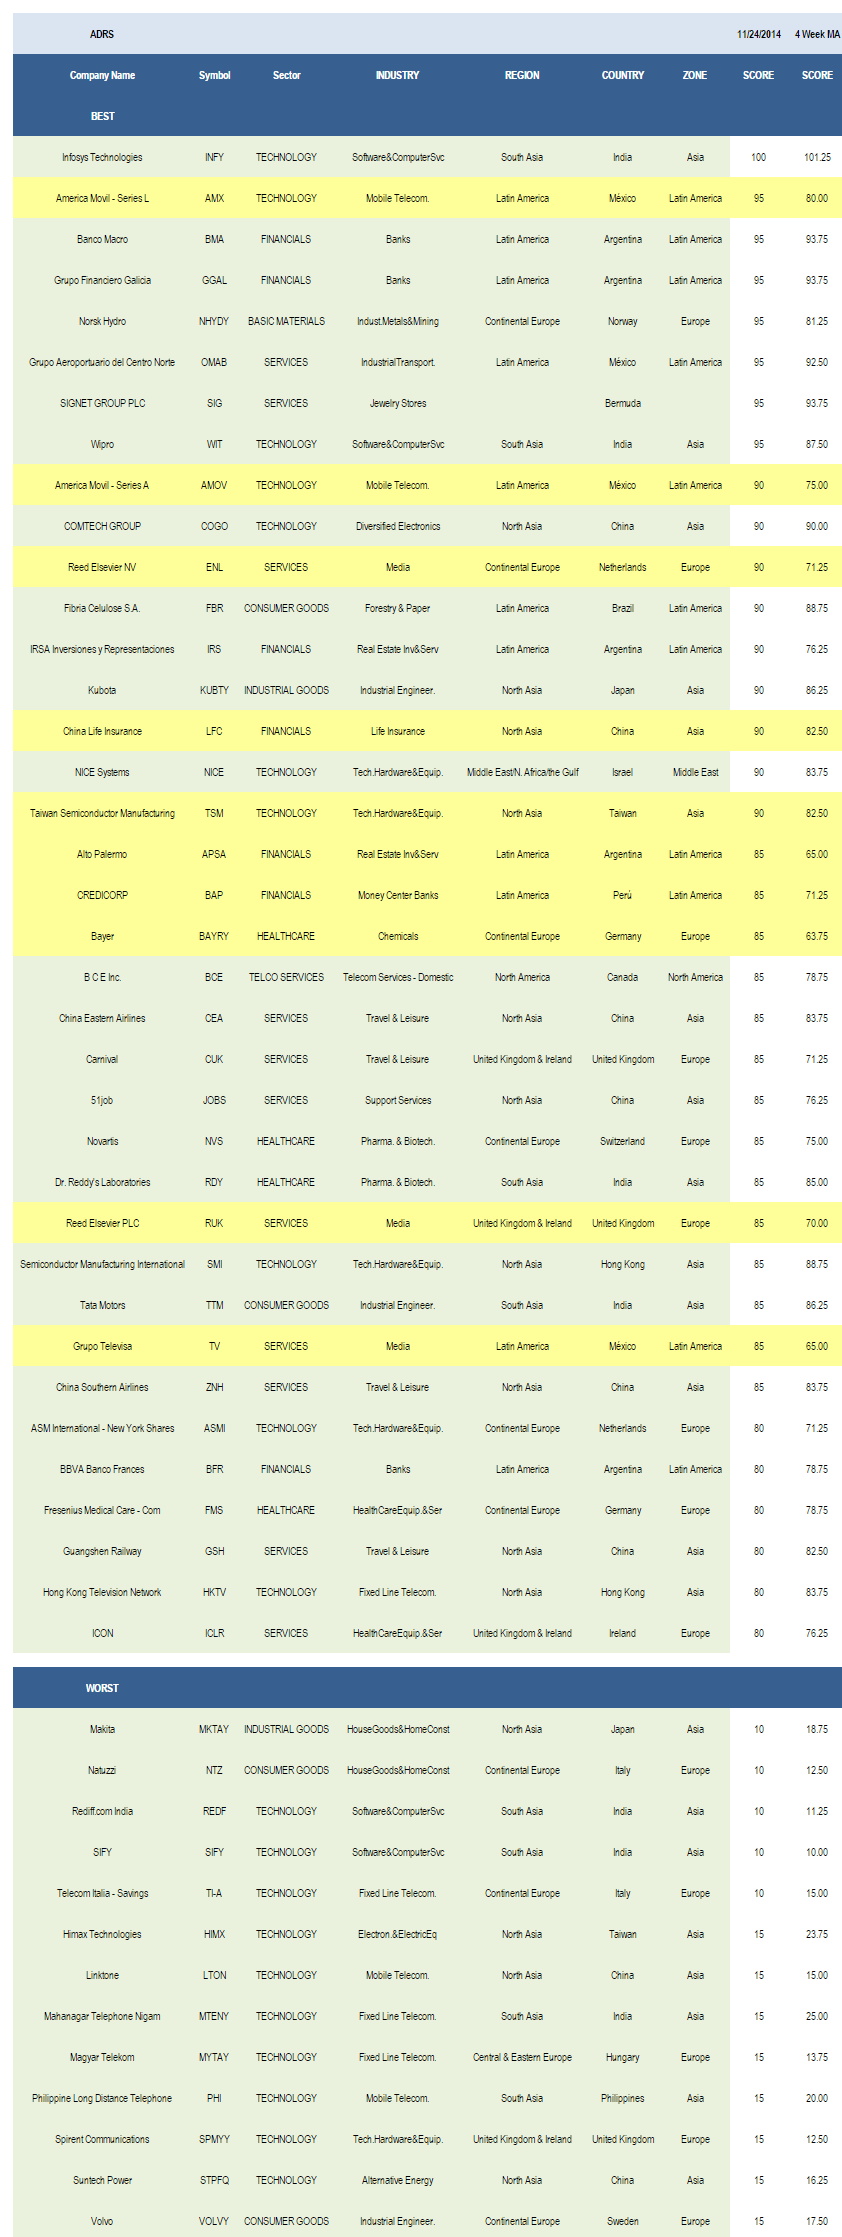
The average score is 51.03 across our ADR universe, above the four week moving average score of 49.40. The average ADR is trading -21.13% below its 52 week high, -3.81% below its 200 dma, has 3.42 days to cover held short, and is expected to post EPS growth of 18.14% next year.
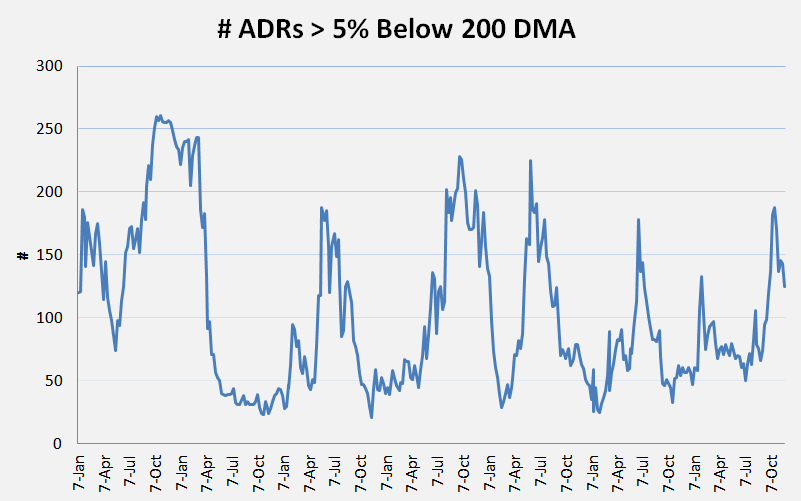
The following chart shows how many ADRs in our ADR universe are trading greater than 5% below their 200 dma. Historically, this has been a good metric for identifying overbought and oversold conditions across the ADR universe. In the most recent week, there are 125 ADRs more than 5% below their 200 dma, down from a peak of 188 ADRs on October 20th.
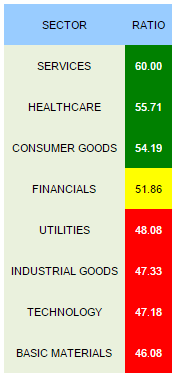
The top scoring ADR sector is services (SIG, OMAB, ENL, ZNH, TV, RUK, JOBS, CUK, CEA, ICLR, GSH). Healthcare (RDY, NVS, BAYRY, FMS, LUX) and consumer goods (FBR, TTM, BRFS, SORL) also score above average. Financials score in line with the universe average score. Utilities, industrial goods, technology, and basic materials score below average.
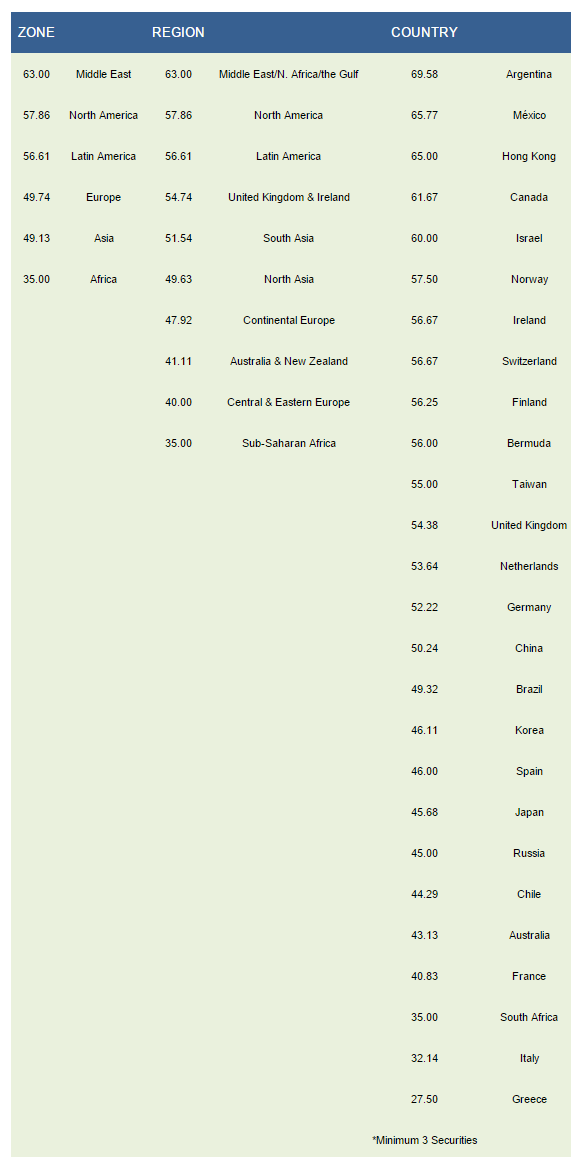
The top scoring zones are the Middle East (NICE, TKC, TEVA) and North America/Canada (BCE, RY, BMO). The best regions are the Middle East, North America, and Latin America (AMX, OMAB, GGAL, BMA, AMOV, IRS, FBR, TV, BAP, APSA, BFR, BRFS, EOC, TEO, BAK). The top scoring countries are Argentina (GGAL, BMA, IRS, APSA, BFR), Mexico (AMX, OMAB, AMOV, TV, ASR, CX), Hong Kong (SMI, HKTV, MPEL), Canada, and Israel (NICE, TEVA).
Disclosure: None.


