
Wisconsin Employment: 108.6K Below Trend Required To Hit Walker’s 250K Target
The Wisconsin Department of Workforce Development released without fanfare (well, there is no press release I see on the DWD media website as of 3pm CDT today) the last figures to be available before the election. They indicate September private nonfarm employment 108.6 thousands below the trend consistent with the Governor’s target (recommitted to a mere year ago) of 250 thousands net new jobs.
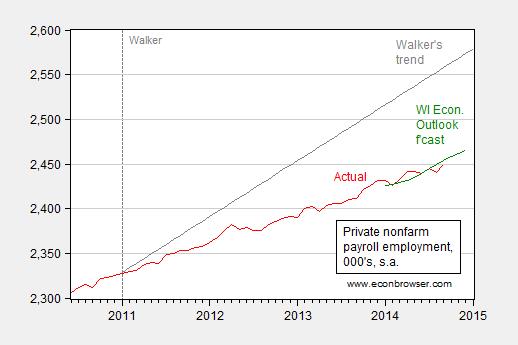
Figure 1: Private nonfarm payroll employment seasonally adjusted (red), trend consistent with Walker’s promise (gray), and Wisconsin Economic Outlook forecast, interpolated (green).
Source: Wisconsin Department of Workforce Development, Wisconsin Economic Outlook (March 2014), author’s calculations.
This tabulation means that Wisconsin must create 32.35 thousands per month for each of October, November, December and January in order to hit the Governor’s target. This is a 4 month growth rate (not annualized) of 1.32%. While this is mathematically possible, it has not occurred in the last 15 years. (It is also not consistent with the Governor’s own Department of Administration/Department of Revenue forecast, as shown by the green line.)
Not only is Wisconsin employment lagging the Governor’s commitment, it is also lagging the rest of the country. Figures 2 and 3 present private nonfarm payroll and nonfarm payroll employment, normalized to 2011M01, for the US and Wisconsin.
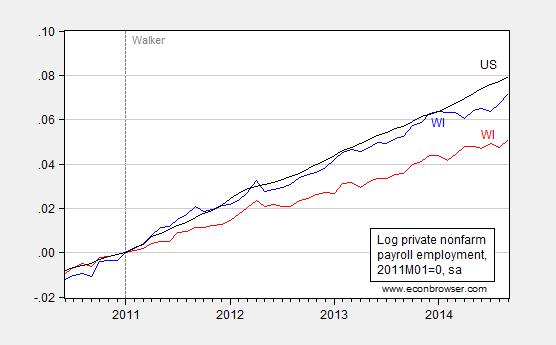
Figure 2: Log private nonfarm payroll employment for Minnesota (blue), for Wisconsin (red), and the US (black), all seasonally adjusted, normalized to 2011M01=0.
Source: WI DWD, MN DEED, US BLS, and author’s calculations.
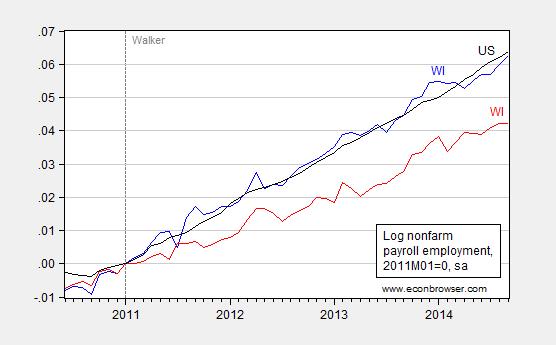
Figure 3: Log nonfarm payroll employment for Minnesota (blue), for Wisconsin (red), and the US (black), all seasonally adjusted, normalized to 2011M01=0.
Source: WI DWD, MN DEED, US BLS, and author’s calculations.
Notice that Minnesota, which Governor Walker previously compared unfavorably to Wisconsin, has outpaced in terms of employment growth. In other words, Wisconsin’s lagging performance cannot easily be rationalized as merely a regional effect. Cumulative employment growth since 2011M01 is 2.1% lower in Wisconsin as compared to its neighbor. A comparison of total nonfarm payroll employment is even more depressing; while the cumulative lag thus far is also 2.1%, but Minnesota’s NFP is pulling away from Wisconsin’s at a faster pace, 2.9% annualized in the last month.
Note that (as far as I can tell), the establishment survey numbers are the ones that the Walker administration are currently favoring, having at some point in the past dispensed with the QCEW figures as “outdated”. In other words, I am citing the data series the Administration was against before they were in favor of.
For a discussion of the QCEW figures, see this post.
Disclosure: None.


